You must be signed in to read the rest of this article.
Registration on CDEWorld is free. Sign up today!
Forgot your password? Click Here!
Introduction
Federally Qualified Health Centers (FQHCs) are directed and governed by the Health Resources and Services Administration (HRSA).1,2 Substantial grant moneys received by HRSA ensure that FQHCs can maintain financial sustainability. Additionally, FQHCs receive these grants under Section 330 of the Public Health Service Act (PHS) and qualifies them to receive enhanced reimbursements from Medicaid and Medicare.2 FQHCs are required to submit data to HRSA’s Universal Data System on an annual basis.3 This data tracks patient demographics, services provided, staffing, clinical indicators, utilization rates, costs, and revenues of grantees at state and national levels on an annual basis. This data assists HRSA in evaluating a program’s effectiveness and intervention of services to improve the health of vulnerable populations.3 Besides the number of dental procedures provided, there are no nationally accepted oral health performance indicators required by HRSA for grantees to report to the uniform data system.3
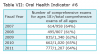
This report provides descriptive statistics based on 10 indicators developed by Healthy People 2020, HRSA, Maternal Child Health, National Quality Forum, the US Department of Health and Human Services (DHHS), and Crescent Community Health Centers dental management over five fiscal years (2007 to 2008 through 2011 to 2012). Dental management selected indicators from these developers because they are leaders in the oral health profession.2,4,5 Oral health is a high priority for these organizations as they have taken the lead to develop oral health measures that reflect the needs of at-risk populations.2,6 This case study offers a model for community health centers with dental departments to follow.
FQHCs with a dental component are a primary safety-net solution for vulnerable populations and help decrease the barriers and inequities at-risk populations face in accessing and using oral healthcare.7-9 The mission of FQHCs is to provide primary care to vulnerable populations in underserved areas.7 The Centers for Disease Control and Prevention (CDC) maintain that there are significant oral health disparities related to socioeconomic status, racial and ethnic groups, geographic locations, age, and gender.10 According to the CDC, oral health disparities continue to progress in the United States.10 Socioeconomic factors contributing to these disparities include race (non-Hispanic blacks, Hispanics, American Indians, and Alaskan natives), age and education. Children aged 2 to 4 and 6 to 8 years, who are black, non-Hispanic, and Mexican-American have twice the amount of decay as white non-Hispanics.11 Those adults with less than a high school education aged 35 to 44 years have three times the decay as college-educated adults.11 Additionally, this same group has three times the amount of destructive periodontal disease.11
David Satcher, Surgeon General of the United States, issued the Oral Health in America—A Report of the Surgeon General more than a decade ago, which revealed gaps in access to oral healthcare, suggesting that Americans do not benefit equally from improvements in healthcare.12-14 The goals of Healthy People 2020 that were established under the leadership of the Federal Interagency Workgroup include improving quality of life while living free of preventable diseases, attaining health equality for all population segments, promoting environments which are conducive to health, both social and physical, and encouraging healthy behaviors through all stages of life.6 Dental departments located in FQHCs play a critical role in the support of those goals by reducing barriers in obtaining oral health services, hence creating a better quality of life for those individuals they serve.15,16
FQHCs are documented leaders in treating chronic diseases and reducing health disparities while maintaining affordability of care.8,17 They are local, non-profit, community needs-driven healthcare providers serving low-income, medical and dental underserved communities. To date, FQHCs have served more than 20 million people across the country with the primary goal to improve access to care for millions of people regardless of their insurance status or ability to pay.8 Iowa is home to 14 FQHCs; of those, 12 have a dental component. FQHCs in the state of Iowa served over 180,000 individuals, providing in excess of 130,000 dental services in 2012.8,17 Ninety-four percent of Iowa’s health center patients have family incomes at or below 200% of the federal poverty line. The federal poverty level guidelines issued by the DHHS, recorded by year in the Federal Register, can be defined as the set minimum amount of gross income a family needs for food, clothing, transportation, shelter, and other necessities and assists in determining financial eligibility for federal programs, including dental clinics of FQHCs.18 The federal government defined the poverty level in 2007, for a family of four, at $20,650—this number increased to $22,350 for 2011.18,19
FQHCs provide a substantial safety net for both prevention and emergent dental care for at-risk populations. FQHCs provide a slide-fee price scale in which fees vary depending on a person’s ability to pay. Ability to pay is based on annual income, family size and US federal poverty guidelines.2 Access to oral healthcare is often constrained based on financial barriers, where one resides, as well as a person’s race and ethnicity. Oral health disparities widen by restricting access to care for at-risk populations. These restrictions impair quality of life, and inflict unnecessary pain and suffering on communities.20-24 The presence of dental clinics in FQHCs improves access to care for low socioeconomic populations by minimizing these barriers.25
Utilization refers to the documented confirmation that patients are using services, as well as the frequency and types of visits.26 Lack of utilization includes:26
1. Oral health literacy
2. Provider distribution and availability
3. Financial limitations
4. Transportation, rural versus urban location
5. Ethnic and cultural preferences
6. Health-related circumstances
Federally qualified dental clinics accept Medicaid patients, offer slide-fee discounts for the uninsured, and provide language interpreters along with transportation.25
One of these health centers, which is located in Dubuque, Iowa (population of 57,637), serves a tri-state region including Illinois and Wisconsin border states.27 According to internal statistics, this health center provided services to more than 6,000 patients, 3,403 being medical and 3,497 dental. Of those, 2,438 (23%) were Medicaid, 3,018 (42%) were uninsured, and 815 were homeless population.
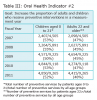
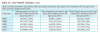
The purpose of this exploratory study was to describe the change in utilization for number and type of visits for Medicaid, uninsured, and privately insured patients of Crescent Community Health Center’s dental department for the fiscal years of 2007 to 2008 through 2011 to 2012. This report provides descriptive statistics based on 10 oral health performance indicators, developed by National Quality Forum, Healthy People 2020, HRSA, Maternal and Child Health Bureau, Health Systems Capacity Indicator, and Crescent’s dental management (Table 1).
Objective of Report
The objective of compiling retrospective data was to establish benchmarks for internal and external quality for dental practice management.
Internal quality is measured as:
• Identify oral health performance indicators most applicable to Crescent Community Health Center’s dental department
• Attaining baseline measures
• Develop ways to improve on clinical outcomes
• Assess benchmarks for provider performance and productivity
• Recognize areas for quality improvement
External quality is measured as:
• Ensure transparency to HRSA, Medicaid, and other grantors
• Educating Crescent Community Health Center community on dental utilization
• Establish data for grant writing
• Demonstrate to stakeholders that healthcare services are being utilized
Methods and Materials
This descriptive analysis used quantitative primary data obtained through this Iowa health center’s administrative records to capture longitudinal trends in type and number of patients utilizing specific oral health services for fiscal years 2007 to 2008 through fiscal year 2011 to 2012. Change in utilization for specific types of visits for Medicaid, uninsured, and privately insured patients of this Iowa health center’s dental department were explored. Table I illustrates the oral health performance indicators, and the developers this report was based on.
Fiscal years for this Iowa health center were defined as November 1 through October 31 for each measurement year, (eg, one fiscal year begins on November 1, 2007, and ends on October 31, 2008). Two electronic medical records, HealthPro and Centricity, were linked to oral health procedures, demographic characteristics, such as race, gender, payer type, provider, and age at the time of service. Data were transferred to Microsoft™ Excel® spreadsheets then to IBM® SPSS® 19, captured dental population characteristics, and oral health service data. The Massachusetts College of Pharmacy and Health Science University Institutional Review Board approved this study.
All records were de-identified to protect patient confidentiality and uphold HIPAA standards. The data included those patients who had at least one dental visit to the Iowa health center’s dental department. Categorical variables such as age, provider type, race, gender, payer type, and procedure type were collapsed for analysis in SPSS. Age ranges were constructed based on the 10 oral health performance indicators measured (Table 1). Additional categories included payer type (Medicaid, uninsured, privately insured), provider type (dental hygienist or dentist), gender (male or female) and race (Caucasian, African American, Hispanic, more than one race, and other). Procedural D-codes were divided into four main categories (preventive, restorative, urgent care, and other). Three additional D-code categories were defined for comprehensive exams, extractions, and sealants. The American Dental Association (ADA) developed a universal dental coding system for dental procedures and nomenclature (CDT) to ensure uniformity and consistency in the recording and billing for dental procedures.28
Results
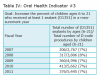
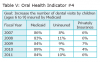
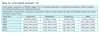
To address the research objective (based on the 10 oral health indicators shown in Table 1), data describes the change in utilization of preventive, restorative, and urgent care procedures for Medicaid, uninsured, and privately insured patients for specific age groups at the time of services from Crescent Community Health Center’s dental department for the fiscal years of 2007 to 2008 through 2011 to 2012 (Table 2 to Table 11). Data were plugged into the formulas and results reported as follows.
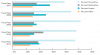
Oral Health Indicator #1—National Quality Forum, Healthy People 2020 OH-11 Goal: Increase the proportion of patients who receive at least one dental visit in a measurement year at a federally qualified health center.
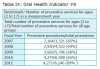
Overall for fiscal year 2007 to 2008 to 2011 to 2012 there were n = 81,673 procedures with 21% (n = 17,167) being unduplicated patients. This shows an increase in unduplicated patients of 87% overall (n = 1844). Figure 1 shows patient utilization percentages with preventive services averaging 46%, restorative 18%, urgent care 22% and other procedures 14%. From fiscal year 2007 to 2008 to fiscal year 2011 to 2012, there was an increase of 106% for preventive, 87% increase in restorative, and a 25% increase in urgent care services.
Oral Health Indicator #2—Healthy People 2020, Oral Health-14, National Quality Forum #1334 Goal: Increase the proportion of adults (aged 22 years and older) and children (aged 0 to 21) who receive preventive interventions in a measurement year.
The proportion of patients in both age groups who received preventive procedures remained stable over the 5-year measurement period. Data showed preventive procedures more than doubled from year 1 to year 5 for age group 0 to 21 from n = 2,407 to n = 4,850 and age group >22 from n = 2,098 to n = 4,415. The overall 5-year average for ages 0 to 21 was 53% and for ages >22 was 47% of all services were preventive in nature.
Oral Health Indicator #3—Health Resources and Services Administration Goal: Increase the percentage of children between 6 and 21 years of age who received at least one sealant (D1351) in a measurement year.
While results show sealants increased from n = 206 to n = 376, the proportion of sealant placement compared to all other procedures utilized remained unchanged, averaging 7% over the 5 years. These results should encourage the providers of this health center to advocate and educate parents on the preventive benefits of sealants for this age group.
Oral Health Indicator #4—Health Systems Capacity Indicator #7b Goal: Increase the percentage of dental visits by children (ages 6 to 9) insured by Medicaid receiving any dental service in a measurement year.
Medicaid utilization for this age group remained stable, averaging 85%, while the uninsured averaged 9%, and privately insured averaged 6%. The goal to increase the percentage of dental visits by children (ages 6 to 9) insured by Medicaid receiving any dental service in a measurement year was not met, showing a 2% decrease in Medicaid from measurement year 1 to year 5, and a 2% increase in uninsured during this same measurement period.
Oral Health Indicator #5—Developed by National Quality Forum, Healthy People 2020 OH-1.1 Goal: Reduce proportion of children (ages 3 to 5) receiving restorative or extraction procedures, while increasing preventive procedures in a measurement year.
From fiscal year 2007 to 2008 to fiscal year 2011 to 2012, preventive procedures increased from n = 545 to n = 865, an upturn of 59%. Restorative procedures increased 56%, while extractions decreased by 40%. Of the n = 81,673 procedures of the total population, 8% (n = 6,269) were from the age group 3 to 5. Of those, 87% (n = 5,479) were Medicaid, uninsured at 5.5% (n = 344), and privately insured 7% (n = 446).
Oral Health Indicator #6—Developed by Health Recourses and Services Administration: Percentage and type of patients 18 years of age and older who received a comprehensive (D0150) examination in a measurement year.
This benchmark showed that, for a 5-year measurement period, there was a 27% increase in comprehensive examinations for the age group >18. In total, there were n = 54,348 procedures over the 5-year measurement period for ages >18. Of those, 6% (n = 3,383) were comprehensive examinations. Payer type breaks down into 37% (n = 1,248) being Medicaid, 57% (n = 1,931) uninsured and 6% (n = 204) privately insured. For gender, females accounted for 59% (n = 2,011), and males 41% (n = 1,372). For races, Caucasian accounted for 82% (n = 2,752), African American 8% (n = 283), Hispanic 6% (n = 216), more than one race 1% (n = 30), and combined races 3% (n = 102).
Oral Health Indicator #7—Endorsed Crescent Community Health Centers Dental Management: Percentage and number of dental services provided by provider type in a measurement year.
For fiscal years 2007 to 2008 through 2011 to 2012, the dental hygiene department provided 39% of all D-code services and 61% by a dentist over the 5-year measurement period.
Oral Health Indicator #8—Guided by Healthy People 2020 OH: 7: Number of dental patients aged 2 to 17 years that had a preventive procedure in a measurement year.
Results of this benchmark showed preventive utilization for this age group increased by 97% (n = 2,164 to n = 4,271 procedures) from measurement year 1, fiscal year 2007 to 2008, to year 5, fiscal year 2011 to 2012.
Oral health Indicator #9—Endorsed and Designed by National Quality Forum #1388: Percentage of Medicaid patients aged 2 to 21 years that had at least one dental procedure during a measurement year shows.
This benchmark showed Medicaid patients aged 2 to 21 years that had at least one dental procedure during a measurement year showed (out of n = 30,154 procedures), 78% were Medicaid compared to all other payer types, with 16% were uninsured and 6% were privately insured. Although the percentage of Medicaid patients for this age group remained stable over this 5-year measurement period, results revealed that 16% of patients in this age group were uninsured.
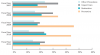
Oral Health Indicator #10—Refers to Healthy People 2020 OH: 3.2: Number of patients aged 65 to 75 with untreated coronal caries in a measurement year. This Iowa’s health center dental management modified this indicator, to increase preventive procedures while decreasing restorative and urgent care procedures for the age group (<65) from previous measurement years.
Figure 2 gives overall 5-year data for age category (<65), showing preventive procedures averaged 39% (n = 1,524), restorative 20% (n = 788), urgent care 25% (n = 978), and other 15% (n = 602). The goal to increase preventive procedures while decreasing restorative and urgent care procedures for this age group of (<65) from previous measurement years is being met. Our findings showed that there was an increase of n = 216 or 140% for preventive procedures, restorative showed an increase of n = 61 or 56%, while urgent care procedures decreased by n = 15 or a 7% reduction. Of those visits, 81% were uninsured, 17% Medicaid, and 2% privately insured.
Overall, this community health center’s dental department provided 50% of procedures (n = 40,723) to Medicaid, 44% (n = 36,033) were uninsured, and 6% were privately insured patients over the five years measured. The racial breakdown showed an average of 75% Caucasian, 13% African American, 7% Hispanics, 2% more than one race, and 3% for other. For gender, females received n = 44,266 procedures, while males utilized n = 37,407.
Discussion
Although there is little consensus among dental professionals on which performance measures should be adopted, the oral health indicators chosen for this report expressed the philosophy of the dental management of Crescent Community Health Center. The 10 oral health indicators, established by Healthy People 2020, HRSA, Maternal Health, National Quality Forum, DHHS, and Crescent Community Health Center’s management were chosen based on the commitment these developers have to improving oral health outcomes for vulnerable populations. The objective of collecting data on the 10 measures were to show evidence of provider performance, accountability to stakeholders, and provide the benchmarks for quality enhancement and ultimately improve oral health outcomes for at-risk populations.
The data showed there was an increase in number of unduplicated patients (86%), as well as an increase of 71% in the number of procedures from fiscal year 2007 to 2008 to fiscal year 2011 to 2012. The dental hygiene department provided significant impact regarding preventive services for oral health performance indicators #2, #3, #5, #6, #7, #8, and #10. Utilization for preventive procedures showed an overall increase of 106%, restorative increased by 87%, and urgent care by 26%. Gender and age at the time of service remained stable in relation to procedure type. For payer type, Medicaid utilization declined slightly while the uninsured population grew. This result implies Crescent Community Health Center is reaching the uninsured populations of this community as affordability to oral healthcare increases access and reduces barriers to services.
Regarding oral health indicator #3, sealant utilization needs to increase. The Pew Center report, Falling Short: Most States Lag on Dental Sealants, provided a strong message that most states are ineffective when it comes to providing sealants to children.29 Pew data showed out of 50 states, only North Dakota, Maine, and New Hampshire where given an “A” grade for sealant placement. Majority of states received a “C” or lower.29 While dental hygienists and dentists understand the importance of sealant placement, our data showed a shortfall of sealant utilization for this community health center. These findings suggest the necessity for increased advocacy, diagnoses, treatment planning, and educating parents on the importance of the benefits of timely sealant placement.30 In a recent New Hampshire study by Chi et al, the proportion of sealant placement compared to all other procedures averaged 12%.31 The results of the current study showed only 7% of all procedures were sealants, roughly half found in Chi’s study. With approximately 80% of all children under the age of 21 having Medicaid and 10% privately insured, this community health center appears to be falling short when it comes to sealant application.
The goal to reduce the proportion of children (ages 3 to 5) receiving restorative or extraction procedures, while increasing preventive procedures, showed measurable change. Preventive procedures increased by 59% (n = 545 to n = 865) and restorative procedures increased 56% (n = 110 to n = 172). Extractions showed the least amount of change at 17% (n = 117 to n = 137) over the 5 years measured. These findings indicate, by reducing barriers, access to preventive utilization for Medicaid children may replace more invasive procedures.32 Again, the Crescent Community Health Center dental hygienists’ role as a preventive specialist influences the change from extractions to restorative through preventive intervention. Hygienists provide and track oral health education, nutritional guidance, and fluoride placement, leading to improved oral health outcomes for this age group (3 to 5).
Additional research is needed to assess the number of patients who received a comprehensive examination compared to the number of patients completing their treatment in a measurement year (oral health indicator #6, patients age <18). The prevalence of unmet dental needs is an ongoing problem for low-income populations, placing them at risk of advanced oral health conditions.33 This dental department needs to use this data to develop a goal to complete treatment plans base on the number of comprehensive exams performed. Developing a plan to track incomplete treatment plans can facilitate better health outcomes for Crescent Community Health Center dental patients.
Most importantly, results of this study revealed the contribution dental hygienists make to this health center, providing close to 40% of all services. Overall, preventive utilization has increased from 39% to 47%, and urgent care utilization showed a slight decline from 15% to 13%. Dental hygienists at this FQHC play a critical role in the success of patient oral health outcomes. The dental hygienist’s role in oral health promotion in this clinic encompass a multitude of services: oral cancer screenings, nutritional guidance, blood pressure screenings, smoking cessation, the delivery of periodontal care, and counseling on the connection between oral health and general health for at-risk populations. Evidence shows that dental hygienists play an integral part in the success in meeting the oral health goals set forth in this report.
Identifying uninsured children should be a priority of Crescent Community Health Center. Even though the percentage of Medicaid patients (ages 2 to 21) receiving at least one dental service in a measurement year remained stable, there were 16% of children in this age group who were uninsured. This data should encourage this community health center’s dental administration to educate and facilitate enrollment of this uninsured child population to an appropriate state children insurance program, as this should translate into increased utilization of all procedure types for this age group.34
The combinations of barriers such as poverty, living in a rural community, paucity of providers, provider acceptance, add to oral health inequities.15,35 This Iowa health center provides a safety net for both prevention and urgent dental care needs for patients experiencing utilization barriers. Given the number of urgent care visits (n = 16,936 over a 5-year period), this data provides a critical tool to support the premise this Iowa community health center’s provision of care may affect local hospital emergency departments.36 The goal for Crescent Community Health Centers is to provide continued access to oral care by reducing barriers that prevent equity in oral health for people of low socioeconomic status, thus reducing the need for emergency department visits.36
Limitations
The limitations of this report lay in the lack of standardization of oral health measures among federally qualified health centers with a dental component. Without integration of oral health measures among health centers, there is no mode to compare discrete measures with other dental departments. Outcome measures evaluated here are not meant to be generalizable to private practice settings but to be used to improve Iowa community health centers dental programs. The strength of this data is that is provides other centers with the model to compare and design measures significant and meaningful to their dental population.
Conclusion
Providing baseline data is instrumental in analyzing deficiencies as well as successes. These oral health indicator measures created a jumping off point for this Iowa health center and provided a model for other dental departments of federally qualified health centers to adopt. Outcome measures provide the tools to create and secure grants for dental programs; they show trends and benchmarks for establishing future goals that improve oral health outcomes for the patients we serve. Baseline measures are a tool, which can promote efficiency in planning for future years. They provide critical data for policy change. Measures promote collaboration between community health centers and lastly provide evidence to our community, stakeholders, professional colleagues, and local business leaders the benefits of having a community health center with a dental component in their community.
About the Authors
Sharon Grisanti, RDH, MCOH, is Dental Program Director of Crescent Community Health Center, a FQHC located in Dubuque, Iowa. Linda Boyd, RDH, RD, EdD is Dean and Professor, Forsyth School of Dental Hygiene at MCPHS University. Lori Rainchuso, RDH MS is the Interim Graduate Program Director at Forsyth School of Dental Hygiene, MCPHS University.
Acknowledgments
The authors thank Julie Woodyard, Executive Director of Crescent Community Health Center for her assistance in choosing the outcome measure most meaningful to Crescent’s dental management and to Mary Brimeyer, CFO of Crescent Community Health Center for her assistance in the extrapolation of data from HealthPro and Centricity electronic medical records. I would also like to acknowledge all dental providers who serve the poor for they are true champions of oral health promotion and equity.
References
1. Research center ADHA. American Dental Hygienists’ Association [Internet]. 2014 [cited 2014 March 2]. Available from: http://www.adha.org/research-center.
2. US Department of Health and Human Services Health Resources and Services Administration [Internet]. Rockville (MD): Health Resources and Services Administration; 2015 [cited 2015 July 14]. Available from: http://www.hrsa.gov/index.html.
3. US Department of Health and Human Services Health Resources and Services Administration. Health center data and reporting [Internet]. Rockville (MD): Health Resources and Services Administration; 2015 [cited 2015 July 14]. Available from http://bphc.hrsa.gov/datareporting/.
4. US Department of Health and Human Services Office of Disease Prevention and Health Promotion. Healthy People 2020 [Internet]. Washington (DC): Office of Disease Prevention and Health Promotion; 2015 [cited 2015 July 14]. Available from: http://www.healthypeople.gov/2020/default.
5. National Quality Forum [Internet]. Washington (DC): 2015 [cited 2015 July 14]. Available from: http://www.qualityforum.org/Home.aspx.
6. Healthy People 2020—Improving the health of Americans. US Department of Health and Human Services Office of Disease Prevention and Health Promotion. 2012.
7. Grover J. Issues faced by community health centers. J Calif Dent Assoc. 2009;37(5):339-343.
8. Riedy CA, Ly KA, Ybarra V, Milgrom P. An FQHC research network in oral health: enhancing the workforce and reducing disparities. Public Health Rep. 2007;122(5):592-601.
9. Shi L, Lebrun LA, Tsai J. Assessing the impact of the health center growth initiative on health center patients. Public Health Rep. 2010;125(2):258-266.
10. Centers for Disease Control and Prevention. Promoting oral health: interventions for preventing dental caries, oral and pharyngeal cancers, and sports-related craniofacial injuries. a report on recommendations of the task force on community preventive services. MMWR Recomm Rep. 2001;50(RR-21):1-13.
11. Centers for Disease Control and Prevention (CDC). Dental caries in rural Alaska native children—Alaska, 2008. MMWR Morb Mortal Wkly Rep. 2011;60(37):1275-1278.
12. US Department of Health and Human Services. Oral Health in America: A report of the surgeon general. US Department of Health and Human Services, National Institute of Dental and Craniofacial Research, National Institutes of Health. 2000.
13. Kleinman DV. The future of the dental profession: Perspectives from oral health in America: a report of the surgeon general. J Am Coll Dent. 2002;69(3):6-10.
14. Oral Health in America: A Report of the Surgeon General. J Calif Dent Assoc. 2000;28(9):685-695.
15. MacDowell M, Glasser M, Fitts M, et al. A national view of rural health workforce issues in the USA. Rural Remote Health. 2010;10(3):1531.
16. Fisher MA, Mascarenhas AK. A comparison of medical and dental outcomes for Medicaid-insured and uninsured Medicaid-eligible children: a US population-based study. J Am Dent Assoc. 2009;140(11):1403-1412.
17. Federally qualified health center (FQHC) resources. Rural Assistant Center [Internet]. 2012 [cited 2012 October 30]. Available from: https://www.raconline.org.
18. Families USA. The voice for health care consumers [Internet]. Washington (DC): 2015 [cited 2015 July 14]. Available from: http://www.familiesusa.org/.
19. US Department of Health and Human Services. 2011 HHS poverty guidelines [Internet]. Washington (DC): 2012 February 2 [cited 2012 February 2]. Available from: http://aspe.hhs.gov/poverty/11poverty.shtml.
20. Bisgaier J, Cutts DB, Edelstein BL, Rhodes KV. Disparities in child access to emergency care for acute oral injury. Pediatrics. 2011;127(6):e1428-1435.
21. Bernabé E, Hobdell MH. Is income inequality related to childhood dental caries in rich countries? J Am Dent Assoc. 2010;141(2):143-149.
22. Flores G, Tomany-Korman SC. Racial and ethnic disparities in medical and dental health, access to care, and use of services in US children. Pediatrics. 2008;121(2):e286-298.
23. Dye BA, Barker LK, Li X, et al. Overview and quality assurance for the oral health component of the national health and nutrition examination survey (NHANES), 2005-08. J Public Health Dent. 2011;71(1):54-61.
24. Dye BA, Thornton-Evans G. Trends in oral health by poverty status as measured by healthy people 2010 objectives. Public Health Rep. 2010;125(6):817-830.
25. Greenberg BJ, Kumar JV, Stevenson H. Dental case management: increasing access to oral health care for families and children with low incomes. J Am Dent Assoc. 2008;139(8):1114-1121.
26. Crall JJ. Access to oral health care: professional and societal considerations. J Dent Educ. 2006;70(11):1133-1138.
27. US Census Bureau. FAQs [Internet]. https://ask.census.gov/. Accessed 10/27/2012, 2012.
28. American Dental Association. Home - American Dental Association [Internet]. Chicago, (IL): American Dental Association; 2015 [cited 2015 July 17]. Available from: http://www.ada.org/.
29. Pew report finds majority of states fail to ensure proper dental health and access to care for children. The Pew Charitable Trusts [Internet]. 2013 [cited 2013 May 5]. Available from: http://www.pewtrusts.org/news_room_detail.aspx?id=57449.
30. Tellez M, Gray SL, Gray S, et al. Sealants and dental caries: dentists’ perspectives on evidence-based recommendations. J Am Dent Assoc. 2011;142(9):1033-1040.
31. Chi D, Milgrom P. Preventive dental service utilization for medicaid-enrolled children in New Hampshire: a comparison of care provided by pediatric dentists and general dentists. J Health Care Poor Underserved. 2009;20(2):458-472.
32. Watson MR, Manski RJ, Macek MD. The impact of income on children’s and adolescents’ preventive dental visits. J Am Dent Assoc. 2001;132(11):1580-1587.
33. Davis MM, Hilton TJ, Benson S, et al. Unmet dental needs in rural primary care: A clinic-, community-, and practice-based research network collaborative. J Am Board Fam Med. 2010;23(4):514-522.
34. Wang H, Norton EC, Rozier RG. Effects of the State Children’s Health Insurance Program on access to dental care and use of dental services. Health Serv Res. 2007;42(4):1544-1563.
35. Kuthy RA, McKernan SC, Hand JS, Johnsen DC. Dentist workforce trends in a primarily rural state: Iowa: 1997-2007. J Am Dent Assoc. 2009;140(12):1527-1534.
36. Smith-Campbell B. Emergency department and community health center visits and costs in an uninsured population. J Nurs Scholarsh. 2005;37(1):80-86.