You must be signed in to read the rest of this article.
Registration on CDEWorld is free. Sign up today!
Forgot your password? Click Here!
Lack of access to oral health care education, preventive and treatment services continues to plague un-served and underserved children, families and elderly in Wisconsin.1 The Northern Area Health Education Center (NAHEC) provides services covering multiple counties in the upper one third of the state in an attempt to improve access to health care to underserved communities. One way NAHEC meets these goals is through educating current and future health care professionals. Another is supporting preventive public health outreach programs. NAHEC serves a 33 county, 30,443 square-mile area, larger than Massachusetts, New Hampshire, Vermont and Delaware combined.1 Forty-six percent of the state’s land mass and 22% of its population, equating to approximately 1.1 million persons, are encompassed here.1
Health Professional Shortage Areas
The Health Resources and Services Administration maintain lists of designated Primary Medical Care, Mental Health and Dental Health Professional Shortage Areas, called HPSAs.2 Geographic areas are designated as Health Professional Shortage Areas (HPSA) based on the following criteria:2
• The area has a population to full-time equivalent primary care physician ratio of at least 3,500:1
• The area has a population to full-time equivalent primary care physician ratio of less than 3,500:1 but greater than 3,000:1 and unusually high needs for primary care services or insufficient capacity of existing primary care providers
• Primary medical care professionals in contiguous areas are over utilized, excessively distant or inaccessible to the population of the area under consideration
Many Northern Wisconsin communities are rural and underserved as defined by national health care standards.2 Thirty of the 64 federally designated Primary Medical Care HPSAs occupy the Northern region (47%), and 26 of the state’s 43 federally designated Dental HPSAs are also in the same region (60%).1 Five of the 11 counties described in the service area are Dental HPSAs.1-2 The combined populations of these counties exceed the state average of persons aged 65+ by more than 5%. The percentage of persons living below poverty levels also exceeds state averages.1
This geographic area is also home to 5 Native American Sovereign Nations. Accessing dental care services for Native Americans depends on varying tribal standards, restrictions and clinic location. Only 1 tribal clinic exists in the geographic service area described. Individuals from other minority groups, or those socioeconomically disadvantaged, cannot typically access dental care services through the tribal clinic.
Problem
Little research exists describing both Quality of Life (QoL) and Quality of Care (QoC) for individuals accessing dental services.3-4 No research exists describing QoL and QoC for individuals accessing preventive dental care services offered by dental hygienists through public health departments. Dental hygienists in local communities are working through the public health department providing oral health education, preliminary screenings and preventive care services. Once individuals are screened, and preventive health care services provided, public health dental hygienists follow a consultation and referral model for addressing restorative care needs. Following systems protocols, referrals are made to Federally Qualified Health Clinics and Community Health Centers and/or private dentists for restorative dental services and case management.2
National Oral Health Care Disparities and Issues
A number of reports confirm the existence of health care disparities nationally.5-29 Of special significance are the reports relating to oral care, including Oral Health in America: A Report of the Surgeon General, and the National Call to Action promoting Oral Health.5,6 Low income and minority populations often lack access to oral health care, causing significant health care disparities. If the ultimate goal of oral health care is disease prevention, focusing on providing care to children seems the most focused approach to achieving success. Once oral health education and preventive care services are provided, it is further necessary to assure individuals experiencing disease are treated efficiently and effectively. An inadequate number of providers is one barrier to offering restorative care, while demographic location and socioeconomic disparities are additional barriers. With inadequate numbers of dentists in the workforce, restorative and surgical needs remain unmet.7 Dentist/population ratios stand at 58/100,000, however, this proportion is projected to decline to 45/100,000 by 2020.7-8 One solution to declining numbers of restorative care providers includes expanding the dental hygiene scope of practice, addressing workforce inadequacies.10-18
Populations and groups present with unique and varying care and access needs. Barriers need to be removed so all people can access preventive and restorative care. Regardless of the needs and differences of populations being studied, be they children, migrant workers, indigenous populations, or those with socioeconomic or demographic differences, no one solution to accessing services is perfect for any specific group.18-29 Even for those with adequate financial resources, access to care still provides barriers.10 Current literature does not describe care or resultant impacts on QoC and QoL for patients accessing care through public health departments.
Care Models for Education and Provision in Other Locations
Different models for bridging the access to care gap and addressing workforce development are necessary. The Advanced Dental Hygiene Practitioner, Dental Health Therapist and Public Health Dental Hygiene Practitioner models can assist in developing and expanding the workforce for meeting oral care needs.9-13,15-18,30-32 Expanding the scope of dental practice and numbers of advanced educational programs available providing education and training for mid-level providers can aid in overcoming workforce development and access to care barriers. The dental therapist model is recognized internationally as an approach for improving access, while reducing care disparities cost efficiently.30-33 Educational curriculum programs combining preventive, restorative, surgical and periodontal content can provide for care needs of both children and adults.10
State Health Care Disparities, Access and Demographic Issues
National disparities are mirrored within the state.9-10,30-39 Inadequate workforce numbers for meeting oral health care restorative needs exist.37-39 Problems associated with access to care are compounded by not only provider numbers, but demographic distribution, ethnicity, practice background/orientation and education.9-10,30-39 Demographic issues alone provide significant challenges to accessing care.9-10,30-38 Data is collected annually by the States’ Population Health Institute documents Programs and Policies, Health Factors and Health Outcomes by county.40 Health Factors data documents clinical care provision, including access and QoC, while Health Outcomes document morbidity as one measure of QoL.40
Quality of Life
QoL is defined as the general well being of individuals and societies, based on wealth, employment, environment, physical and mental health, education, recreation and leisure time, and a sense of social belonging.39,41 Dental disease, along with these factors, affects QoL.39,41-48 The Population Health Institute ranks QoL annually for each of the states’ 72 counties. Rankings are based on weighted summaries for individual communities that consider quality of health care, environment, individual behaviors, education and jobs.49 Ranking is dynamic, based on changes as counties improve health outcomes by addressing all health factors with effective, evidence based programming and policies.49 Adequately measuring and documenting QoL outcomes has been considered elusive by researchers and experts, as epidemiologic data being collected and evaluated is renormed annually. Norm, rather than criterion referencing for this measure, is a significant issue while considering the validity of findings. County and state rankings are triangulated with data from the Centers for Disease Control (CDC).49 Results are considered both a call to action and used as necessary data tools for evidence based decision making for change initiated by community leaders.
Quality of Care
The 21st Century Institute of Medicine definition of QoC includes care that is safe, effective, patient centered, timely, efficient and equitable.46 Thus, safety is the foundation upon which all other aspects of quality care are built. The Population Health Institute considers clinical care as a measure of health factors combining both access and quality of care.49 Health behaviors, local environment and social and economic factors are also evidence-based measures considered annually. Clinical care accounts for 20% of this measure, health behaviors account for 30%, social and economic factors 40% and environmental factors 10%. Even though clinical care accounts for only 20% of this measure, both access to and QoC impact county performance rankings. This data is used for public health policy formation and implementation within public health departments.49
Protocols for Care in Service County
Service and care protocols for meeting the challenges of improving both QoL and QoC measures in the demographic region are documented and followed.50 Evidence based practice drives clinical care provision, providing care for populations with low socioeconomic status and/or diverse ethnic backgrounds.
Purpose
The purpose of this research was documenting QoL and QoC measures for families receiving care from dental hygienists within public health departments, and considering if oral health for families with economic disparities and cultural differences improved.
Materials and Methods
A descriptive research study was conducted following Institutional Review Board approval and exemption. Using a retrospective records review, public health data from 2004 through 2009 was examined. The research question the study sought to address was: “Do preventive oral health programs based in local health departments provide QoC Services, thus impacting QoL for underserved populations in Dental HPSAs?” Records evaluated describe documenting access to select oral health care services and the resultant outcomes for individuals living in rural, socioeconomically disadvantaged communities.
Population and Sample
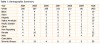
The study sample was drawn from a rural population within 1 of the state’s 72 counties in a geographically isolated region in the northern third of the state. One county’s records were examined. The study’s convenience sample included 2,364 CDC Sealant Efficiency Assessment for Locals and States (CDC SEALS) records spanning a 6 year period. These records held data for all children accessing various oral health care services through a county’s public health school based outreach program. A limitation of this approach is generalizability of findings to larger populations. The demographic breakdown of the study population is in Table I.
Data Collection & Analysis
Data analysis was descriptive in nature, documenting and evaluating existing data from the CDC SEALS records for clients served in the county studied. This information begins documenting access to oral health care services offered by dental hygienists working through public health departments in rural, socioeconomically disadvantaged communities. Data from the CDC SEALS database for preventive care services documents various QoC measures. Data from the University of Wisconsin School of Medicine and Public Health Reports was examined for documenting QoL measures.49 For the purposes of this study, data analysis for quality of care measures specifically focused on care provided to children through the school-based sealant program.
Results
Quality of Care
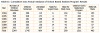
A review of CDC data indicated 2,364 children received oral health education (100%), of which 1,745 (74%) of the children educated received oral screenings. Cumulative and annual results are documented in Table II. Of the 1,745 children screened, 1,511 (87%) had dental sealants placed, and 804 (46%) with dental caries were referred to federally qualified health centers or private practices for restorative services. Of the 804 children referred, 463 (58%) had dental restorations placed and received follow-up care. Referrals follow a consultative referral protocol.50 Fifty-nine minority children (3.9%) received services and the populations and care provided are described in Tables I and II. Additional analyses revealed 30 to 35% of the total counties’ school-aged child population were Medicaid recipients. Twenty percent of those accessing services had private dental insurance and self-selected out of the program, while the remaining children (45%) receiving care were uninsured.
Quality of Life
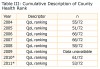
The UW School of Medicine and Public Health yearly reports, the Wisconsin County Health Rankings, noted Northern Highland counties were almost all rated below state averages.49 Health rankings are 1 to 72, 1 being best and 72 worst, based on the number of counties in the state. Of special note, under the category Health Outcomes (based on excess deaths and self-reported health status), 80% of Northern Highland counties metrics consistently ranked in the bottom half of the state (Table III). While considering another key measure, Health Determinants (reflecting health care, health behaviors, socioeconomic factors and physical environment), 70% of Northern Highland counties also ranked in the bottom half of the state.49 Examination of the QoL metrics indicate significant needs for the persons living in these rural areas. It is notable that QoL rankings from 2004 to 2011 show only gradual improvements.
Study findings provided illustrate similar national findings. The PEW Report provided Wisconsin with a grade of “C,” identifying the states meeting 4 of 8 benchmarks.14 Similar problems plaguing national populations- lack of access to oral care and being socioeconomically disadvantaged also plague the population described in this study.5-6,11-29 A childhood of dental issues can lead to a lifetime of oral health problems, if early interventions are not implemented. Relatively low cost solutions including oral health education, fluoride and sealant programs can result in less time lost at school, work, less disease burden and less pain. Long-term impacts from dental disease burden on the entire health care system population could be reduced with education, early intervention and changes in workforce paradigms.
Table I describes the demographics of the population served in Wisconsin. Of the 1,511 children receiving services, it should be noted only 59 (3.9%) were from reported minority groups. A total of 1,452 (96.1%) children receiving service were Caucasian. The largest of the minority groups receiving sealants as a preventive care measure were Native American (25, 1.6%). Where the overarching program goal was improving oral health for families with economic disparities and cultural differences, the data documents the cultural groups reported here were an extremely small percentage of those actually served.
Additional analysis of socioeconomic status determined 30 to 35% of the study populations were Medicaid recipients, and approximately 45% were uninsured. These findings illustrate the socioeconomic need and status of children and families accessing care through the school based sealant program. Dental hygienists offering low cost, education and prevention programs through public health departments can positively impact the health of individuals within communities when services are offered through local area schools.
While considering data in Table II regarding QoC, it should be noted the initial numbers of children screened and treated were higher, declining over time. The reasons for this were two-fold: first, funding supporting the programs became restricted, and secondly, there were changes in the numbers of schools participating in the program. Direct connections between program participation and school funding reductions were identified. As school budgets declined preventive programs, similar to the Arts, were some of the first cancelled. Numbers of children screened also declined. This decline was directly proportional to reduced funding, and school district boards determining they could no longer participate in preventive health programs, even though these programs were clearly cost efficient in relation to preventing community disease burden. Individuals on educational boards often do not understand how disease affects student performance, resulting in lost productivity or classroom hours when making budgetary cuts. From a public health perspective, funding these programs for community vitality is wise. Data in Table II also documented declines over time in numbers of children requiring urgent care as they entered the referral pipeline for restorative care. Children requiring early care also declined over time as referrals were made through the preventive program for required intervention and treatment. Declining disease burden in the communities’ children resulted in declining need for restorative care. Numbers of children participating in and receiving oral health education and dental sealants in the program remained constant from year to year, possibly as a result of families recognizing using preventive measures resulted in lowering care expenses and oral disease burden. Numbers of referrals required for restorative care also declined over time. The consultative/referral model works successfully for meeting the preventive and restorative care needs of children in this community in a cost efficient manner. Implementing various school based outreach programs through public health departments can expand access to care for minority and socioeconomically disadvantaged, underserved populations across the country. Implementation of educational and preventive programs like these also allows dental hygienists to pursue alternative career options beyond traditional clinical practice. Dental hygienists employed through public health departments can make significant contributions improving both access to and quality of care for school-aged children.
Consideration of the data reflecting QoL measures and findings is slightly more problematic as reported in Table III. The University of Wisconsin Population Health Institute has produced the Wisconsin County Health Rankings as part of epidemiologic data tracked by the University of Wisconsin School of Medicine and Public Health.41 Data appears to document improvements, however slight, in the epidemiologic reporting on the QoL measures for the population studied. QoL metrics basis were 2 categories: Health Outcomes (deaths/self-reporting health status) and Health Determinants. Determinant data included health behaviors, socioeconomic factors and physical environment. Initial QoL outcomes data for 80% of recipients ranked in the bottom half of state, while 70% of person’s original determinant data was also ranked in the bottom half of reported metrics. Counties were ranked from 1 to 72, 1 being considered the best county to live in and 72 the worst. Each year, for both categories, the public health department studied has made improvements as reflected in the QoL data. Where cumulatively the county still ranks in the lower third for this overall measure, it appears yearly rankings are slowly improving.49 Significant concerns exist with using this data for determining if QoL was truly improved for the population studied. First, data is renormed annually. Thus, data is dynamic in nature. Secondly, data gathered and analyzed for this measure continues evolving as public health concerns evolve. With data being renormed annually, and resultant changes from said renorming, data validity becomes questionable. Another consideration includes inter-examiner consistency and reliability for those gathering and reporting data with epidemiologic research team changes. When measuring QoL, these are significant limitations affecting consistency of the state’s epidemiological data. If differing researchers are considering and reporting on the analytic data found, yearly differences in interpretation or results are likely being reported. Politicians and public policy makers use these health data outcomes for determining funding of public health programs. This raises troubling questions about social justice when state funding supporting public health preventive care programs is limited when data for determining state health outcomes lacks consistency from year to year.
Identifying QoL metrics might be better measured using a survey. Surveying populations receiving care might be a better technique for gathering data determining if quality of life has been improved. An appropriate survey focused on QoL questions would need to be developed. A survey might provide better insight into people’s perception of improved QoL rather than reliance on broader, epidemiologic data for making that determination. One recommendation for a future study includes conducting a focused survey asking questions determining if QoL was impacted rather than using state and national data from an epidemiologic perspective.49 Additional study determining QoC and QoL for other public health departments programs in the Dental HPSA shortage areas should be conducted. A final recommendation includes further developing and offering a conceptual framework considering the intersections between QoC, QoL, workforce development and access to care issues. This conceptual model could be used as a benchmark tool using QoC and QoL for measuring impact of public health dental hygiene practice and program effectiveness.
Two apparent issues emerged from this investigation: significant access and demographic bottlenecks exist in the pipeline to oral health care services and workforce development issues as noted by a documentable lack of providers. Both these issues have multifactoral considerations, and each is considered separately.
Access to Care
Considerable effort has been undertaken highlighting access to care issues. Recent reports developed by Beazoglou et al51 and Bailit52 for the state’s dental association and department of health services workforce development taskforce took the perspective that Wisconsin’s dental workforce needs are no more than a marketing supply and demand issue, rather than access to care issue. The predominant issues are deeper than marketing, and several issues regarding access to care require consideration.51-55 Several potential solutions are offered here for discussion.
Number of Work Hours per Calendar Year
The average person working full time spends approximately 1,750 to 2,000 hours each year at work.56,57 Beazoglous’ Wisconsin dental workforce study reported practices averaging 1,385 hours per year.51 Analysis of this data identified dental care providers worked 415 to 615 hours less than full time employees in various businesses and industry.53-57 According to Beazoglous’ convenience survey, it was reported restorative services were offered 30 to 32 hours per week.51 This equates to 43 weeks of part time work, with 5 weeks unscheduled yearly.51,53,54,56,57
Access to restorative care services illustrated by this data alone highlights one access to care issue. If oral care practitioners worked the same amount of time as other health care providers or full time employees in business and industry, access issues might decline. Dental hygienists performing expanded functions could have foreseeable impact on QoL for residents located in rural, socioeconomically disadvantaged communities. Broadening access to care, while increasing workforce capacity and improving QoL could be achieved using the Advanced Dental Hygiene Practitioner, Dental Health Therapist or Public Health Dental Hygiene Practitioner models for meeting oral care needs.11-13,15,16,30,31
Scheduling Practices
Scheduling practices typically follow traditional business models. Scheduling presents another access to care issue. Access to oral health care services, similar to medical care, should follow Medical Models.32,58-61 Dental hygienists working through public health departments can expand access by offering care in alternative settings, at alternative times, for meeting care needs of community populations.
Care Models
Another actionable consideration for improving access to care includes developing and putting in place Clinical Emergency Models. In the Medical Model, people access the Emergency Room for acute care and services.32,33,58-61 Similar to the Medical Model, “safety net” dental clinical locations could provide dental emergency care. Once emergency care is provided, patients are referred back to community practices. In this way, there are clearly defined “safety nets” for care reducing barriers to access.13,58-61 Dental hygienists trained in providing expanded functions, can similarly affect access to care.
Removal of Practice Restrictions
Another bottleneck exists at the system level - legislative restrictions regarding access to care currently exists.62,63 Dental hygienists occupational preparation includes providing educational and preventive care services for individuals, groups and communities.15,16 Hygienists are being limited by legislative practice acts to providing care within specific practice settings or locations. Changing legislative codes would allow dental hygienists to provide their full scope of practice if legislative practice act restrictions are removed.62,63
Measureable actions like these can begin shifting oral health care disparities. For changes to occur legislators and restorative oral health care providers mental paradigms have to shift first. Access to care ultimately improves QoC and QoL for all citizens. Increasing the number of provider service hours worked, modifying scheduling practices, and developing emergency care locations are practical and viable solutions to addressing access concerns. Removal of legislative restrictions is another solution for addressing problems associated with accessing care.
Workforce Development
Workforce development is another opportunity. Declining numbers of restorative practitioners due to impending retirements, stagnant workforce development and state demographic issues are important considerations associated with accessing care, even if unpublished state data minimizes these problems.51,52 Career laddering and educational opportunities for dental hygienists offering expanded functions can assist in developing and expanding the workforce for meeting oral care needs of the populace.11,15,58-61,64 Using alternative care models and hygienists trained in expanded function care services can impact QoC and QoL for patients in underserved, socioeconomically disadvantaged rural communities.
Conclusion
Dental hygienists delivering services through public health departments can influence QoL through QoC services. As a result of this descriptive research, oral health education and sealant delivery were deemed safe through Wisconsin Dental Examining Board records and clinically effective (SEALS database). It was determined the consultation and referral model works effectively for linking individuals with restorative services, including routine follow up. Additionally, alternative programs can improve access to care for individuals with economic disparities and cultural differences.
Jodi L. Olmsted, RDH, BS, MS, EdS, PhD, is an Assistant Professor at the University of Wisconsin Stevens Point in the College of Professional Studies, School of Health Care Professions. She is also a distance education consultant for Kaleidoscope Consulting, LLC. Nancy Rublee, RDH, CDHC, is a Public Health Dental Hygienist at the Price County Public Health Department. Emily Zurkawski, PTA, BS, is a physical therapist assistant at Aegis Therapies. Laura Kleber, BS, graduated from the University of Wisconsin Stevens Point, majoring in Health Care Administration, and works as a Research Administrative Assistant for Aurora.
References
1. About Us. Wisconsin Area Health Education Centers [Internet]. [cited 2010 Nov 1]. Available from: http://www.ahec.wisc.edu/
2. U.S. Department of Health and Human Services. HRSA Designation Criteria. U.S. Department of Health and Human Services. 2010.
3. McGrath C, Bedi R. The value and use of ‘quality of life’ measures in the primary dental care setting. Prim Dent Care. 1999;6(2):53-57.
4. Astrom A, Ekback G, Ordell S, Unell L. Social inequality in oral health related quality-of-life, OHQoL, at early older age. Acta Odontol Scand. 2011;69(6):334-342.
5. U.S. Department of Health and Human Services. Oral Health in America: a repost of the surgeon general. U.S. Department of Health and Human Services, National Institute of Dental and Craniofacial Research, National Institutes of Health. 2000.
6. U.S. Department of Health and Human Services. National call to action to promote oral health: A public-private partnership under the leadership of the office of the surgeon general. U.S. Department of Health and Human Services, National Institute of Dental and Craniofacial Research, National Institutes of Health. 2003.
7. Dentists: Occupational Outlook Handbook. Bureau of Labor Statistics [Internet]. 2008. Available from: http://www.bls.gov/oco/ocos072.htm
8. Healthiest Wisconsin 2020: Everyone living better longer. Wisconsin Department of Health Services [Internet]. 2010 [cited 2011 April 16]. Available from: http://dhs.wisconsin.gov/statehealthplan/hw2020/index.htm
9. Direct Access States. American Dental Hygiene Association [Internet]. 2009 [cited 2011 April 16]. Available from: http://www.adha.org/direct-access
10. Access for all: strategies for increasing access to primary health care. Wisconsin Primary Health Care Association [Internet]. 2009 [cited 2011 April 16]. Available from: http://www.wphca.org
11. Nash DA, Friedman JW, Kardos TB, et al. Dental therapists: a global perspective. Int Dent J. 2008;58(2):61-70.
12. Nash DA. Expanding dental hygiene to include dental therapy: improving access to care for children. J Dent Hyg. 2009;83(1):36-44
13. Niederman R, Gould E, Soncini J, Tavares M, Osborn V, Goodson JM. A model for extending the reach of the traditional dental practice: the ForsythKids program. J Am Dent Assoc. 2008;139(8):1040-1050.
14. The cost of delay: state dental policies fail one in five children. Pew Center on the States [Internet]. 2010. Available from: http://www.pewtrusts.org/uploadedFiles/Cost_of_Delay_web.pdf
15. Lyle DM, Malvitz DM, Nathe C. Processes and perspectives: the work of ADHA’s task force on the Advance Dental Hygiene Practitioner (ADHP). J Dent Hyg. 2009;83(1):45-47.
16. Competencies for the Advanced Dental Hygiene Practitioner (ADHP). American Dental Hygienists’ Association [Internet]. [cited 2011 Mar 10]. Available from: http://www.adha.org/downloads/competencies.pdf
17. Hyde, Satariano S, WA, Weintraub, JA. Welfare dental intervention improves employment and quality of life. J Dent Res. 2006;85(1):79-84.
18. Manski MC, Parker ME. Early childhood caries: knowledge, attitudes, and practice behaviors of Maryland dental hygienists. J Dent Hyg. 2010;84(4):190-195.
19. Lukes SM. Oral health knowledge attitudes and behaviors of migrant preschooler parents. J Dent Hyg. 2010;84(2):87-93
20. Quandt SA, Clark HM, Rao P, Arcury TA. Oral health of children and adults in Latino migrant and seasonal farm worker families. J Immigr Minor Health. 2007;9(3):229–235.
21. Slesinger DP. Health status and needs of migrant farm workers in the United States: a literature review. J Rural Health. 1992;8(3):227–234.
22. Hansen E, Donohoe M. Health issues of migrant and seasonal farmworkers. J Health Care Poor Underserved. 2003;14(2):153–164.
23. Lukes SM, Miller FY. Oral health issues among migrant farm workers. J Dent Hyg. 2002;76(2):134–140.
24. Wells PL, Caplan DJ, Strauss RP, Bell D, George M. An oral health survey of the Lumbee Tribe in southeastern California. J Dent Hyg. 2010;84(3):137-144.
25. Jones DB, Niendorff WJ, Broderick EB. A review of the oral health of American Indian and Alaska native elders. J Public Health Dent. 2000;60(Suppl 1):256–260.
26. Broderick EB, Niendorff WJ. Estimating dental treatment needs among American Indians and Alaska natives. J Public Health Dent. 2000;60(Suppl 1):250–255.
27. Jansson H, Lindholm E, Lindh C, Groop L, BratthallG. Type 2 diabetes and risk for periodontal disease: A role for dental health awareness. J Clin Periodontol. 2006;33(6):408–414.
28. Schroth RJ, Harrison RL, Moffatt ME. Oral health of indigenous children and the influence of early childhood caries on childhood health and well-being. Pediatr Clin North Am. 2009;56(6):1481-1499.
29. Maupomé G, Karanja N, Ritenbaugh C, Lutz T, Aickin M, Becker T. Dental caries in American Indian toddlers after a community-based beverage intervention. Ethn Dis. 2010;20(4):444-450.
30. Dyer TA, Robinson PG. Public awareness and social acceptability of dental therapists. Int J Dent Hyg. 2009;7(2):108-114.
31. Finkelman R. The public health dental hygiene practitioner: an alternative perspective. Access. 2009;23(7):26-29.
32. Janus K, Amelung V, Baker L, Gaitanides M, Schwartz F, Randall T. Job satisfaction and motivation among physicians in academic medical centers: insights from a cross-national study. J Health Polit Policy Law. 2008;33(6):1133-1176.
33. Committee on the Quality of Health Care in America. Crossing the quality chasm: A new health system for the 21st century. Institute of Medicine [Internet]. 2001 March 1. Available from: http://www.iom.edu/Reports/2001/Crossing-the-Quality-Chasm-A-New-Health-System-for-the-21st-Century.aspx
34. Elliot-Smith S. Solving the access to care issue in Minnesota: state becomes the first to sign mid-level oral health care providers into law. Access. 2009;23(7):14-19.
35. Powell W, Hollis C, de la Rosa M, Helitzer DL, Derksen D. New Mexico community voices: policy reform to reduce oral health disparities. J Health Care Poor Underserved. 2006;17(1 Suppl):95-110.
36. Edgington E, Pimlott J, Cobban S. Societal conditions driving the needs for advocacy education in dental hygiene. Can J Dent Hyg. 2010;43(6):267-274.
37. Wisconsin County Health Rankings. University of Wisconsin Population Health Institute [Internet]. 2007 [cited 2011 April 16]. Available from: http://uwphi.pophealth.wisc.edu/programs/match/wchr/index.htm
38. Kuthy RA, McKernan SC, Hand JS, Johnsen DC. Dentist workforce trends in a primarily rural state: Iowa: 1997-2007. J Am Dent Assoc. 2009;140(12):1527-1534.
39. Booske B, Roubal A, Graupner A, Bergum A, Kindig D, Remington P. Health of Wisconsin report-card- 2010. University of Wisconsin Population Health Institute [Internet]. 2010. Available from: http://uwphi.pophealth.wisc.edu/programs/match/healthiest-state/report-card/2010/
40. Peppard P, Kindig D, Remington P, Riemer A, Dranger E. Wisconsin County Health Rankings-2003. Wisconsin Public Health and Health Policy Institute [Internet]. 2003 [cited 2011 November 16]. Available from: http://uwphi.pophealth.wisc.edu/programs/match/wchr/2003/index.htm.
41. Sanders AE, Slade GD, Lim S, Reisine ST. Impact of oral disease on quality of life in the US and Australian populations. Community Dent Oral Epidemiol. 2009;37(2):171-181.
42. Tsakos G, Gherunpong S, Sheiham A. Can oral health related quality of life measures substitute for normative needs assessment in 11 to 12 year old children? J Public Health Dent. 2009;66(4):263-268.
43. Vargsas CM, Arevalo O. How dental care can preserve and improve oral health. Dent Clin North Am. 2009;53(3):399-420.
44. Richards W, Harris C, Gear T. Oral health-related quality of life. Br J Health Care Management. 2009;15(4):181-187.
45. Humphris G, Freeman R, Gibson B, Simpson K, Whelton H. Oral health-related quality of life for 8-10 year old children: an assessment of a new measure. Comm Dent Oral Epidemiol. 2005;33(5):326-332.
46. Crossing the quality chasm: A new health system for the 21st century. Institute of Medicine. 2001 March 1. Available from: http://www.iom.edu/Reports/2001/Crossing-the-Quality-Chasm-A-New-Health-System-for-the-21st-Century.aspx
47. Steele JG, Sanders AE, Slade GD, et al. How do age and tooth loss affect oral health impacts and quality of life? A study comparing two national samples. Comm Dent Oral Epidemiol. 2004;32(2):107-114.
48. Sampogna F, Johansson V, Axtelius B, Abeni D, Soderfeldt B. Quality of life in patients with dental conditions: comparing patients’ and providers’ evaluation. Comm Dent Health. 2009;26(4):234-238.
49. Rublee N. Price County seal a smile dental sealant agency protocol. Department of Health and Family Service, Division of Public Health [Internet]. 2005. Available from: http://www.cphfoundation.org/documents/PriceCountyWIOtherPHPrevention_000.pdf
50. McGrath C, Bedi R. Population based norming of the UK oral health related quality of life measure (OHQoL-UK). Br Dent J. 2002;193(9):521.
51. Beazoglou T, Bailit H, Myne V, Roth K. Supply and Demand for Dental Services: Wisconsin 2010-2020. Wisconsin Dental Association [Internet]. 2010 January. Available from: http://www.wda.org/wp-content/uploads/2012/04/Supply-and-Demand_Final-Report.pdf
52. Bailit H. Oral Health Education Study: Project 0913D. docstoc [Internet]. 2010 March. Available from: http://www.docstoc.com/docs/49246066/Oral-Health-Education-Study
53. Wisconsin Public Health Workforce 2008. Wisconsin Department of Health Services [Internet]. 2008 [cited 2011 April 6]. Available from: http://www.dhs.wisconsin.gov/publications/P4/P45719-08.pdf.
54. Dentist shortages for low-income populations in Wisconsin: CY 2007. Wisconsin Department of Health Services [Internet]. 2007 [cited 2011 Apr 6]. Available from: http://www.dhs.wisconsin.gov/health/primarycare/index.htm.
55. Adams T. Inter-professional conflict and professionalization: dentistry and dental hygiene in Ontario. Soc Sci Med. 2004;58(11):2243-52.
56. The Fair Labor Standards Act (FLSA). U.S. Department of Labor [Internet]. [cited 2011 November 19]. Available from: http://www.dol.gov/compliance/laws/comp-flsa.htm
57. BLS Information: Glossary: F. US Department of Labor Statistics [Internet]. [cited 2011 November 19]. Available from: http://www.bls.gov/bls/glossary.htm#F
58. Wiggins C, Hatzenbueler L, Peterson T. Hospital missions and the education of our future health care workers. J Allied Health. 2008;37(3):132-136.
59. Kash B, May M, Tai-Seale M. Community health worker training and certification programs in the United States: findings from a national survey. Health Policy. 2007;80(1):32-42.
60. Harrison R, Mitchell L. Using outcomes-based methodology for the education, training and assessment of competence of healthcare professionals. Med Teach. 2006;28(2):165-170.
61. Thomas H, Hicks J, Martin G, Cressey G. Induction and transition in the National Health Service for four professional groups. Learn Health Soc Care. 2008;7(1):27-36.
62. Dentistry examining board. Wisconsin Statutes Database [Internet]. 2011 [cited 2011 November 19]. Available from: http://docs.legis.wi.gov/statutes/statutes/447.pdf
63. Dentistry and Dental Hygiene - Code Book. Wisconsin Department of Safety and Professional Services [Internet]. [cited 2011 November 19]. Available from: http://drl.wi.gov/board_code_detail.asp?boardid=13&locid=0.
64. Dental Hygienists. Occupational Outlook Handbook. Bureau of Labor Statistics, U.S. Department of Labor [Internet]. 2008. Available from: http://www.bls.gov/oco/ocos097.htm.