You must be signed in to read the rest of this article.
Registration on CDEWorld is free. Sign up today!
Forgot your password? Click Here!
Dental fluorosis is defined as the hypomineralization of tooth enamel resulting from chronic, excessive ingestion of fluoride during tooth development, particularly during the pre-eruptive enamel maturation period.1-4 Dental fluorosis of primary teeth is uncommon as primary tooth development primarily occurs in utero; however, if dental fluorosis does occur in primary teeth, it is most commonly observed in the gingival third of the second primary molars.5 The development of the anterior permanent teeth, in general, begins at approximately ages 15 to 30 months. Therefore, this is a critical time to avoid excess fluoride exposure for the aesthetic appearance of the anterior teeth.5
The degree of dental fluorosis severity is fluoride dose dependent. Mild dental fluorosis generally appears as barely visible opacities at the incisal or cuspal edges of teeth; it can also appear as white striations or lacy markings following the enamel perikymata.1,6 Severe dental fluorosis can have a heavily stained, pitted, friable enamel appearance.1,6 Generally, the opacities associated with fluoride exposure are symmetrical on contralateral teeth, although post-eruptive staining and attrition of friable enamel associated with severe fluorosis can result in dissimilar appearances of contralateral teeth.7 In an analysis of national data from 1986-1987 and 1999-2002, there was a nearly 10% increase in dental fluorosis prevalence in participants, aged 6 to 10 years, from 22.8% to 32.2%.4
Increasing amounts of available information regarding factors contributing to dental fluorosis and changes in personal behaviors, has led to periodic revisions of the recommendations for fluoride supplementation.8,9 The American Dental Association lowered the fluoride supplement schedule in 1994 and the American Academy of Pediatrics endorsed the change shortly thereafter.10,11 The purpose of this study was to determine if there was a difference in the prevalence of dental fluorosis by comparing National Health and Nutrition Examination Survey (NHANES) data for the years 2001-2002 and 2011-2012 in adolescents, aged 16 and 17 years, as a result of the reductions recommended in 1994. There were several reasons for choosing adolescents aged 16 and 17 years for this research. First, the impact of the 1994 fluoride supplement recommendation change had the potential to be discovered in adolescents aged 16 and 17 years in the 2011-2012 data set (i.e., children born in 1994-1996) when compared to adolescents aged 16 and 17 years in the 2001-2002 data set (i.e., children born in 1984-1986 before the 1994 recommendations on fluoride reductions). Second, full mouth, rather than partial mouth, fluorosis evaluation was more likely when evaluating children ages 16 and 17 years than in younger children who were more likely to be in mixed dentition with unerupted permanent teeth, partially erupted permanent teeth, and permanent teeth with surfaces obscured by orthodontic brackets or bands. Finally, although NHANES data included fluorosis information for the years 1999-2004, the contiguous years for 2011-2012 (NHANES data sets 2009-2010 and 2013-2014) did not include fluorosis information.
Methods
The West Virginia University Institutional Review Board acknowledged this study as non-human subject research (protocol number 1605104903). A cross-sectional study design was used to determine the difference in fluorosis for adolescents identified in 2001-2002 as compared to adolescents identified with fluorosis in 2011-2012.
Data Source
The data sources for this study were the NHANES 2001-2002 and NHANES 2011-2012. The NHANES is a survey conducted by the National Center for Health Statistics to survey the health and nutritional status of non-institutionalized U.S. residents through interviews and physical examinations.7 The NHANES dataset is a nationally representative, publicly available survey with a complex and multistage sampling design. NHANES interviews were conducted in participants' homes and include sociodemographic, dietary, and health-related information. The health examinations contain medical, dental, laboratory and physiological measurements as well as laboratory tests. Examinations were conducted in specially designed mobile centers and administered by trained medical or dental personnel. Each year approximately 5,000 participants are enrolled.7 NHANES researchers use many of the same questions and test annually; however, changes do occur and questions or procedures can be discontinued, modified, or added in certain years. Researchers use a complex survey design with each participant representing a people similar socioeconomic characteristics. Incorporating the weights and other aspects of the study design in the calculations improves the accuracy of results. Details of the NHANES research procedures are available on the NHANES website.7
Licensed dentists with a DDS or DMD degree served as the examiners for the dental fluorosis evaluations in the NHANES studies.7 Data quality assurance was achieved through initial education and calibration of the examiners and periodic monitoring, recalibration and review.7 The reference examiner observed and repeated 20-25 examinations when he or she visited the examiners.7 There were 1-3 site visits conducted per year to maintain reliability and acceptable inter-rater levels.
Dental fluorosis was determined clinically by NHANES dental examiners using a mirror and a modified Dean's fluorosis classification system on permanent (not primary) teeth in participants who were 6-19 years of age using the same technique employed in 2011-12 as well as in 1999-2004.7 Six categories were used for tooth assessment: normal (translucent, smooth, glossy, pale creamy white); questionable (slight aberrations, a few white spots); very mild fluorosis (less than 25% of tooth has small, white areas); mild fluorosis (between 25% and 50% of the tooth has white areas); moderate fluorosis (50% or more of the tooth with all surfaces involved, with or without brown stains); and, severe fluorosis (all enamel is involved and has discrete or confluent pitting) if its contralateral tooth was also affected.7 The basis for classifying a person's fluorosis status was the categorization of the two most affected teeth.7 The lesser affected tooth was to be used to identify the person's status if the two most affected teeth were not equally affected.7
In this study, dental fluorosis severity was defined using the definitions provided by the CDCmodified Dean's fluorosis classification system. However, due to sample size limitations, severity level was collapsed into: normal, questionable, and very mild/more; and further collapsed into a dichotomized variable of fluorosis status (very mild/more vs. normal/questionable) as was used in previous research on fluorosis.12-14 The dichotomized variable was used to account for small sample sizes that could not be increased by merging data from contiguous years as fluorosis was not examined in 2009-10 or 2013-14 (years contiguous to 2011-2012) although it was examined in 1999-2000 and 2003-2004 (years contiguous to 2001-2002).
The year of observation (2011-2012 versus 2001-2002) was the main variable. In developing models of logistic regressions, additional variables were selected based upon Krieger's Ecosocial Theory in which embodiment of conditions are the result of biological characteristics, social factors, life course, race/ethnicity, and sex.15 The model was selected due to the previous associations of fluorosis with 1) having access to fluoride and 2) having enabling resources (higher socioeconomic status).8,9 The additional variables included in the study were: sex (male, female); race/ethnicity (Non-Hispanic white, Non-Hispanic black, Mexican American, other); medical insurance (yes/no); and federal poverty level (less than 125% of the federal poverty level, 125% to less than 200% of the federal poverty level, 200% to less than 400% of the federal poverty level, and 400% and above). These variables are factors associated with the Ecosocial Theory. Data concerning adolescents, aged 16 and 17 years, were extracted from the available data of children aged 6-19 years for this study.
Statistical Analysis
Frequency determinations, Rao Scott Chi Square analyses and logistic regression analyses were completed using SAS 9.3® (Cary, NC) software. The complex study design was considered in the analyses. Survey weights provided by NHANES researchers were used to improve the variance estimates. The weights used were adjustments for the representation of a record for the segment of the population represented. Significance was set at an alpha of 0.05.
Results
Sample Description
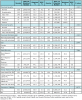
Details of the overall sample are presented in Table I. There were 586 eligible participants in 2001-2002 and 289 eligible participants in 2011-2012 (n=875) who had complete NHANES data. Females accounted for 45.7% of the 2001-2002 sample and 54.3% of the 2011-2012 sample (weighted percentages). The analysis excluded 33 participants from the 2001-2002 data sets due to missing data; 14 participants from the 2011-2012 data sets were excluded due to missing information. The race/ethnicity distributions, insurance prevalence, and family income to poverty ratio had no significant differences between 2001-2002 and 2011-2012.
Ten-year differences in fluorosis
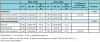
Using the severity of fluorosis as defined by the NHANES modified Dean's classification, in 2001-2002 the prevalence was 49.8% normal, 20.5% questionable, 21.3% very mild, 6.8% mild, 1.6% moderate, and none identified as severe (Table II). In 2011-2012, the prevalence was 31.2% normal, 7.5% questionable, 18.6% very mild, 18.3% mild, 24.3% moderate, and 1.6% severe. Overall, there was a 31.6% increase in fluorosis prevalence (P<.0001) when comparing rates from 2011-2012 with those from 2001-2002. Percentages were weighted to improve generalizability.
Logistic regression on fluorosis
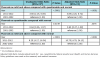
Table III contains the results of logistic regression for the analysis using two categories (very mild and above, and the reference, normal/questionable). The unadjusted odds ratio for the years 2011-2012 versus 2001-2002 was 3.60 (95% confidence interval [CI]: 2.15, 6.05; P <.0001). In adjusted analysis with sex, race/ethnicity, federal poverty level and insurance, the odds ratio was 3.85 (95% CI: 2.20, 6.72; P <.0001).
Multinomial logistic regression for the analysis using three categories (very mild and above, questionable, and the reference, normal) is also presented in Table III. The 2011-2012 vs 2001-2002 unadjusted odds ratio for questionable fluorosis and the reference, normal, was 0.64 (95% CI: 0.26, 1.57; P=0.3149). The adjusted odds ratio was 0.65 (95% CI: 0.27, 1.59; P=0.3375).
The 2011-2012 vs 2001-2002 unadjusted odds ratio for mild and above fluorosis and the reference, normal, was 8.25 (95% CI: 4.17, 16.34; P <.0001). The adjusted odds ratio was 10.75 (95% CI: 4.79, 24.13; P <.0001).
Discussion
Findings of this study reveal an increase in the prevalence of very mild and above dental fluorosis over the decade, as evidenced by comparing its prevalence in 2001-2002 with that of 2011-2012. There was a lack of national contemporary literature concerning dental fluorosis trends in the U.S. with which to compare this study. However, in a review conducted in 1999, dental fluorosis was clearly increasing in communities with community water system (CWS) fluoride levels below 0.3 parts per million and there were indications of a similar trend with optimal CWS fluoride levels.16 Researchers of a study conducted in 2003-2004 with North Carolina school children from kindergarten to high school seniors indicated that 71.8% of the children had no fluorosis, 24.4% had questionable to very mild fluorosis, and 3.7% had mild, moderate, or severe fluorosis using the Dean's classification system.17 The 2001-2002 data for normal/questionable prevalence (70.3%) from the current study supports the findings of the North Carolina study.
In a national survey of children aged 12-15 years, a comparison was made of dental fluorosis prevalence in 1986-1987 and 1999-2004. There was an increase from a prevalence of 22.6% in 1986-1987 to 40.7% in 1999-2004.18 That study, although evaluating change over a different time period, demonstrated trends in the same direction as the results from this study. However, the two studies are not fully comparable due to variations in the ages of the children evaluated and the study designs.
It has been noted that there is a lack of available current epidemiologic data on fluorosis in the U.S. which leads to uncertainty about its prevalence and severity. In addition, there is a little data concerning changes in the prevalence of fluorosis over time, especially in regards to the 1994 modification to fluoride supplementation guidelines from the American Dental Association.16 This study adds additional data points and trends regarding the incidence of fluorosis to consider.
This study had limitations. While the examiners were all calibrated to the same criteria, the gold standard calibration examiner was not the same individual in both of the years studied (2001-2002 and 2011-2012). This discrepancy may have influenced the interpretation of the degree of fluorosis reported.
Strength of this study include the data sources and methodology. NHANES is a well-designed, nationally representative program of studies in which the same criteria were used in 2001-2002 and in 2011-2012. The NHANES studies evaluated full mouth dental fluorosis. It is noteworthy that fluorosis can be described in a number of ways at the tooth or person level, as well as on multiple levels in which it is either dichotomized or exists with several severity levels. The variety of options to evaluate fluorosis can be considered both a strength and a limitation to increasing the knowledge based regarding this condition.
Policy recommendations
Fluoride is available to many children in their water, toothpaste, varnishes, topical fluoride applications, and foods. Exposure to greater than optimal fluoride levels results in fluorosis. Guidelines for reducing the recommended fluoride supplementation were first introduced in 1994 due to the wider availability of fluoride. In 2015, The Federal Panel on Community Water Fluoridation of the U.S. Department of Health and Human Services recommended that the optimal fluoride level in CWS should be 0.7 mg per liter of water representing an approximately 0.1-0.5 mg per liter reduction for most CWSs.19 Recommendations have also been made regarding the use of toothpastes containing fluoride. A parent/guardian should brush his/her child's teeth or supervise the child while the child is brushing to prevent the child from swallowing toothpaste. Caries assessment should be the basis for prescribing and recommending high fluoride concentration toothpastes20 as well as considering all possible sources of fluoride in a child's diet at home and away from home. Other dietary fluoride supplements or prescribed fluoride pharmaceuticals (such as prescription fluoride gels or varnishes) should follow similar caries risk assessments and appropriate guidelines.
Conclusions
There was a difference of 31.6% in dental fluorosis prevalence recorded in adolescents aged 16 and 17 years between 2012-2011 and 2002-2001. The presence of fluorosis was evaluated in a nationally representative survey by calibrated dental examiners using the modified Dean's fluorosis classification system. Data analysis of the prevalence of fluorosis severity was collapsed to very mild/above vs. normal/questionable due to limited sample sizes in the moderate fluorosis and severe fluorosis categories in 2001-2002 and 2011-2012. Results from this study suggest that the prevalence of dental fluorosis continued to rise despite the 1994 recommendations by the American Dental Association to lower fluoride supplementation. Dental professionals, parents and health communities in general should be aware of incidence of dental fluorosis while not disputing the benefits of fluoride for caries prevention and control.
Acknowledgements
Research reported in this publication was supported by the National Institute of General Medical Sciences of the National Institutes of Health under Award Number U54GM104942. The content is solely the responsibility of the author and does not necessarily represent the official views of the National Institutes of Health. The funders had no role in study design, data collection and analysis, decision to publish, or preparation of the manuscript.
About the Authors
R. Constance Wiener, MA, DMD, PhD, is an assistant professor, Department of Dental Practice and Rural Health, West Virginia University, Morgantown, WV; Chan Shen, PhD, is assistant professor, Department of Health Services Research and Biostatistics, University of Texas MD Anderson Cancer Center, Houston, TX; Patricia A. Findley, DrPH, is an associate professor of social work, Rutgers University, Newark, NJ.
Usha Sambamoorthi, PhD is a professor; Xi Tan, PhD is an assistant professor, both in the Department of Pharmaceutical Systems and Policy, West Virginia University, Morgantown, WV.
Corresponding author: R. Constance Wiener, MA, DMD, PhD; rwiener2@hsc.wvu.edu
References
1. Burt BA, Eklund SA, editors. Dentistry, Dental Practice and the Community. 6th ed. St. Louis: Elsevier Saunders; 2005. 287-292 p.
2. Rozier RG, Adair S, Graham F, Iafolla T, Kingman A, Kohn W, et al. Evidence-based clinical recommendations on the prescription of dietary fluoride supplements for caries prevention. JADA. 2010 Dec;141(12):1480-1489.
3. Martinez-Mier EA, Shone DB, Buckley CM, Ando M, Lippert F, Soto-Rojas AE. Relationship between enamel fluorosis severity and fluoride content. J Dent. 2016 Mar;46:42-6.
4. Beltran-Aguilar ED, Barker LK, Canto MT, Dye BA, Gooch BF, Griffin SO. Surveillance for dental caries, dental sealants, tooth retention, edentulism, and enamel fluorosis-United States, 1988-1994 and 1999-2002. MMWR. 2005 Aug;54(3):1-43.
5. Levy SM. An update on fluorides and fluorosis. J Can Dent Assoc. 2003 May;69(5):286-91.
6. Spencer AJ, Do LG. Caution needed in altering "optimal" fluoride concentration in drinking water. Community Dent Oral. 2016 Apr;44(2):101-8.
7. NHANES Dental Examiners Procedures Manual, 2001. [Report on the Internet]; [citied 2016 Dec 5]. 218 pages. Available from:http://www.cdc.gov/nchs/data/nhanes/oh-e.pdf
8. Pendrys DG, Katz RV. Risk of enamel fluorosis associated with fluoride supplementation, infant formula, and fluoride dentifrice use. Am J Epidemiol. 1989 Dec;130(6):1199-208.
9. Pendrys DG, Katz RV, Morse DE. Risk factors for enamel fluorosis in a nonfluoridated population. Am J Epidemiol. 1996 Apr;143(8):808-15.
10. ADA American Dental Association, Council on Dental Therapeutics. New fluoride schedule adopted; therapeutics council affirms workshop outcome. ADA news 1994 May;25:12-14.
11. Klish WJ, Baker SS, Flores CA, et al. AAP American Academy of Pediatrics, Committee on Nutrition. Fluoride Supplementation for children: Interim policy recommendations. Pediatrics. 1995 May;95:777.
12. Bal IS, Dennison PJ, Evans RW. Dental fluorosis in the Blue Mountains and Hawkesbury, New South Wales, Australia: policy implications. J Investig Clin Dent. 2015 Feb;6(1):45-52.
13. Nor NA, Chestnutt IG, Chadwick BL. Examiner reliability in fluorosis scoring: a comparison of photographic and clinical methods. Community Dental Health. 2016 Jun;33(2):145-50.
14. Moimaz SA, Saliba O, Marques LB, et al. Dental fluorosis and its influence on children's life. Braz Oral Res. 2015 Jan;29(1):1-7.
15. Krieger N. Epiemiology and the People's Health: Theory and Context. New York: Oxford Press; 2011. p 202-235.
16. Rozier RG. The prevalence and severity of enamel fluorosis in North American children. J Public Health Dent. 1999 Fall;59(4):239-46.
17. Onoriobe U, Rozier RG, Cantrell J, King RS. Effects of enamel fluorosis and dental caries on quality of life. J Dent Res. 2014 Oct;93(10):972-79.
18. Beltran-Aguilar ED, Barker L, Dye BA. Prevalence and severity of dental fluorosis in the United States, 1999-2004. Department of Health and Human Services. National Center for Health Statistics. [Internet]. 2010:53 [cited 2016 Dec 5]. Available from: https://stacks.cdc.gov/view/cdc/5802/cdc_5802_DS1.pdf
19. Gooch BF (correspondent). U.S. Public Health Service recommendation for fluoride concentration in drinking water for the prevention of dental caries. Public Health Reports. 2015 July-Aug;130:1-14.
20. Pretty IA. High fluoride concentration toothpastes for children and adolescents. Caries Res. 2016 Apr;50 Suppl 1:9-14.