You must be signed in to read the rest of this article.
Registration on CDEWorld is free. Sign up today!
Forgot your password? Click Here!
Dynamic electrocardiographic (ECG) monitoring is a standard of practice when providing general anesthesia, but opinions are mixed regarding its use during moderate (conscious) and deep sedation. The American Dental Society of Anesthesiology included pulse oximetry for patient monitoring in its guidelines published in 1991.1 The guidelines at that time also encouraged ECG monitoring during deep sedation, but not during moderate (conscious) sedation. The American Dental Association recently revised its monitoring guidelines to include ECG monitoring for all deeply sedated patients and for consciously sedated patients with compromised cardiovascular function.2 Most publications in the medical anesthesia literature regard ECG monitoring as a standard for both sedation and anesthesia,3 but many experts question its actual value in preventing sedation-related morbidity and mortality among patients without preexisting cardiac risk. Despite this controversy, a growing number of state dental boards are requiring ECG monitoring for general anesthesia and all levels of intravenous sedation.
Disregarding these legal controversies, there is an intangible reassurance provided by an ECG monitor that adds to that provided by periodic measurement of blood pressure and continuous pulse oximetry. This of course presumes that the operator is comfortable witnessing occasional benign arrhythmias and the subtle mechanical nuances all monitors present during routine use. The purpose of this continuing education article is to provide fundamental concepts of ECG recognition that will enable the dentist to feel more comfortable with the routine use of dynamic ECG monitoring.
GENERAL PRINCIPLES OF CARDIAC FUNCTION
The output of the heart per minute (cardiac output) is the paramount cardiovascular event required to sustain blood flow throughout the body. In addition to blood volume and contractile strength, the heart must sustain a regular cycle of relaxation and contraction if it is to fulfill its objective. This regularity is predicated on a series of complex electrophysiological events within the cardiac tissues that can be monitored using a device called the electrocardiogram. This device is variably referred to as an ECG or as an EKG, the latter based on the Greek term ‘‘kardia’’ for heart. Many prefer EKG to ECG because it is less likely to be confused verbally with EEG, the abbreviation for electroencephalogram. However, we will arbitrarily adopt ECG for this presentation.
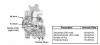
The quintessential events required for a normal cardiac cycle are the rhythmic contraction and relaxation of the atria and ventricles. The heart is composed of two principal cell types: working cells and specialized neural like conductive cells. The working cells are the muscle or myocardium of the atria and ventricles. Specialized cells include the sinuatrial (SA) node, the atrioventricular (AV) node, the bundle of His, and the Purkinje fibers (Figure 1). These cells initiate and conduct electrical impulses throughout the myocardium, and this regulates the rhythm of a cardiac cycle. In order to initiate impulses, specialized cells have a property called automaticity, which reflects an ability to initiate electrical impulses spontaneously. This is independent of any nerves or hormones, but their actual rate of firing can be influenced by autonomic nerves, with sympathetics increasing and parasympathetics decreasing their rate. Each cardiac cycle commences with an impulse, spontaneously generated by the SA node, that subsequently spreads throughout the remainder of the neural-like conductive tissues and onto the muscle (myocardial) cells. Abnormalities within this conduction system will compromise cardiac output and are called arrhythmias or dysrhythmias synonymously.
ELECTROPHYSIOLOGICAL CONSIDERATIONS
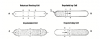
To fully appreciate electrical impulses and the information provided by an ECG, we must first review fundamental concepts regarding electrical membrane potentials. All cardiac cell membranes are positively charged on their outer surfaces because of the relative distribution of cations. This resting membrane potential is maintained by an active transport mechanism called the sodium-potassium pump. When the cell is stimulated, ion channels open, allowing a sudden influx of sodium and/or calcium ions and thereby reversing the resting potential. This period of depolarization is very brief because sodium channels close abruptly, denying further influx of sodium. Simultaneously, potassium channels open and allow intracellular potassium to diffuse outward while sodium ions are actively pumped out. This reestablishes a positive charge to the outside of the membrane, a process called repolarization that returns the membrane to its resting membrane potential. The processes of depolarization and repolarization are referred to collectively as an action potential. This event self-propagates as an impulse along the entire surface of a cell and from one cell to another, provided that their membranes are connected (Figure 2).
It is essential that one address the actual purpose of an action potential. All human cells exhibit this phenomenon, and its purpose varies according to the cell’s function. The purpose of action potentials in neurons is to initiate release of neurotransmitters that either excite or stabilize cell membranes of the tissue innervated. In skeletal and cardiac muscle cells, action potentials release stored calcium ions that initiate the actual contractile process.
Cells comprising the heart’s conduction system are unique in two aspects. First of all, they possess automaticity. The physiological explanation for this property resides in the resting membrane’s partial permeability to calcium and/or sodium ions. The gradual inward ‘‘leak’’ of cations decreases the voltage of the resting potential until a threshold is reached. At this point, all channels open and rapid cation influx depolarizes the membrane. The second unique characteristic of this specialized tissue is the fact that, unlike classic neural tissue, these cells do not release neurotransmitters. Instead, they are in direct contact with cardiac muscle, and their action potential initiates depolarization of the cardiac muscle cells directly.
Cardiac muscle cells are fused to one another by special attachments called intercalated discs. This allows them to function as a continuous sheet of cells called a syncytium.4 The atrial syncytium is separated from that of the ventricles by a layer of connective tissue that acts as an insulator. The SA node initiates depolarization of the atrial muscle, but the insulation precludes propagation into the ventricles except at one place, the AV node. The AV node delays and finally relays the impulse along the common bundle of His, which penetrates the connective tissue to enter the ventricles. The impulse continues along the common bundle of His and its branches until it finally reaches the Purkinje fibers, which ignite the ventricular muscle syncytium.
The action potential of an individual cell can be measured using microprobes inserted through its cell membrane. It is far too small an electrical event to be measured by surface electrodes. However, action potentials that spread throughout the muscle syncytia of the heart are great enough for surface electrodes to record and produce a tracing known as an ECG. It is important to appreciate that the ECG cannot record electrical events generated by the specialized cells of the conduction system; their voltages are far too small. What you observe in an ECG tracing is the action potentials of the atrial and ventricular muscle cells. However, other events can be deduced from the tracing.
THE ECG TRACING
The electrical sequence of a cardiac cycle is initiated by the sinoatrial node, the so-called pacemaker of the heart. This is because the SA node has a faster rate of spontaneous firing than the remaining specialized tissues (see Figure 1). However, if this rate should decrease, other portions of this specialized system can gain control, a phenomenon termed escape.
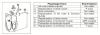
The baseline of an ECG tracing is called the isoelectric line and denotes resting membrane potentials. Deflections from this point are lettered in alphabetical order, and following each, the tracing normally returns to the isoelectric point. The first deflection is the P wave and represents depolarization of atrial muscle cells. It does not represent contraction of this muscle, nor does it represent firing of the SA node. These events are deduced based on the shape and consistency of the P waves. One assumes that the SA node fires at the start of the P wave, and one assumes that atrial contraction begins at the peak of the P wave. Although atrial repolarization follows depolarization, the ECG provides no evidence of this event. A popular misconception is that evidence of repolarization is obscured by the subsequent QRS complex. Were this true, however, repolarization would be observed in cases where the QRS complex is delayed or absent, eg, AV blocks. The correct explanation is that atrial repolarization is too minor in amplitude to be recorded by surface electrodes.5,6
The QRS complex represents depolarization of ventricular muscle cells. The Q portion is the initial downward deflection, the R portion is the initial upward deflection, and the S portion is the return to the baseline, or the so-called isoelectric point. Often, the Q portion is not evident and the depolarization presents as only an ‘‘RS’’ complex. In any case, the complex does not represent ventricular contraction. One assumes that contraction will commence at the peak of the R portion of the complex. Unlike contraction of the atria, ventricular contraction can be confirmed clinically by palpating a pulse or by monitoring a pulse oximeter waveform. A patient in cardiac arrest may have normal QRS complexes on his or her ECG; ventricular muscle cells are depolarizing, but there is no contraction. This phenomenon is called pulseless electrical activity. Following depolarization, ventricular muscle repolarizes, and this event is great enough in amplitude to generate the T wave on the ECG tracing.
The PR interval is measured from the beginning of the P wave to the beginning of the R portion of the QRS complex. (This is conventional because the Q portion of the complex is so frequently indiscernible.) Because the PR interval commences with atrial muscle depolarization and ends with the start of ventricular depolarization, one can assume that the electrical impulse passes through the AV node into the ventricle during this interval. If the PR interval is prolonged, one may deduce that AV block is present. The electrical events of an ECG are illustrated and summarized in Figure 3.
TECHNICAL CONSIDERATIONS
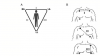
In 1901 a Dutch physiologist, Willem Einthoven, developed a galvanometer that could record the electrical activity of the heart. He found that a tracing can be produced as action potentials spread between negatively and positively charged electrodes. (A third electrode serves to ground the current.) He found that tracings varied according to the location of the positive and negative electrodes, and subsequently described three angles or leads in the form of a triangle with the heart in the middle. This is known today as Einthoven’s triangle, and the three electrode arrangements are known as the primary limb leads I, II, and III (Figure 4). As research continued throughout the 20th century, additional arrangements were discovered that enable physicians to analyze electrical events as they spread in many directions through the heart, much like an apple slicer sections an apple into various parts. Today, the cardiologist analyzes a 12-lead ECG to aid in diagnosing infarctions, hypertrophy, and complex arrhythmias. Our purpose in this article, however, is to identify only the basic arrhythmias that justify dynamic ECG monitoring during sedation and general anesthesia. For this purpose, a single-lead ECG is all that is required. Most often, lead II is selected because it generally records the largest waves.
ECG PAPER
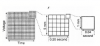
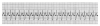
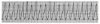
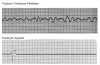
An ECG monitor displays a tracing that lacks any grid as background. However, most of these monitors are equipped with optional printers that can generate a gridded printout if desired. As the stylus of the recording device is deflected by electrical currents, the recording paper is moving at a speed of 25 mm/s. This creates an ECG tracing whose components can be measured. The vertical axis of an ECG denotes voltage and the direction of waveforms from the baseline. These considerations are generally irrelevant during routine monitoring, but have significance for diagnosing ischemia and infarction. The horizontal axis denotes time and sequence of events, both of which are essential for arrhythmia recognition. Standard ECG recording paper is divided into small and large squares. The former represent 0.04-second intervals. Five small squares constitute a large square, which represents 0.20 seconds. Notice, in Figure 5, that the lines between every five boxes are heavier, so that each 5-mm unit horizontally corresponds to 0.2 seconds (5 X 0.04 = 0.2). The ECG can therefore be regarded as a moving graph with 0.04- and 0.2-second divisions.
ECG ANALYSIS
Dynamic ECG monitors display heart rate, but it can also be ascertained from a printed tracing using either of two methods:
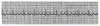
1. When the heart rate is regular, count the number of large (0.2-second) boxes between two successive QRS complexes and divide 300 by this number. The number of large time boxes is divided into 300 because 300 X 0.20 = 60 and heart rate is calculated in beats per minute or 60 seconds. For example, if there are three large boxes between QRS complexes, the heart rate is 100 beats/min, because 300 X 3 = 100. Similarly, if four large time boxes are counted between QRS complexes, the heart rate is 75 beats/min (Figure 6).
2. If the heart rate is irregular, the first method will not be accurate because the intervals between QRS complexes vary from beat to beat. In most cases, ECG graph paper is scored with marks at 3-second intervals. In such cases simply count the number of QRS complexes every 3 or 6 seconds and multiply this number by 20 or 10, respectively.
How one chooses to analyze an ECG rhythm strip is arbitrary. Each clinician must adopt a sequence of analysis that accommodates personal methods of reasoning. Always keep in mind that events during the PR interval pertain to supraventricular activity. When abnormalities are detected, try to establish the event as ventricular or supraventricular in origin. The following sequence represents one suggestion for analysis of an ECG tracing. The author describes it as a five-step analysis. Refer to Figure 6 during the following explanation.
Step 1: Is the Rhythm Regular or Irregular?
If the intervals between QRS complexes (R-R intervals) are consistent, ventricular rhythm is regular. If intervals between P waves (P-P intervals) are consistent, the atrial rhythm is regular. In Figure 6 the rhythm is regular.
Step 2: Are All QRS Complexes Similar, and Are They Narrow?
The duration of the QRS complex should not exceed 0.10 seconds (2½ small squares). A widened complex indicates ventricular enlargement (hypertrophy) or that ventricular depolarization is being initiated by pacemaker tissue below the AV node, eg, ventricular-paced rhythm. In this case, one ventricle depolarizes first and the current must spread into the second ventricle. This takes more time than when the current spreads down the bundle into both ventricles simultaneously. If QRS complexes are narrow, the rhythm is being initiated by a pacemaker at the AV node or higher and is described as a supraventricular rhythm. If the complexes are wide, the pacemaker is in the ventricles and is described as a ventricular rhythm. Should complexes vary in appearance, more than one pacemaker is generating impulses. This phenomenon is referred to as ectopic pacemakers, and the rhythm described as ectopy.
Step 3: Are All P Waves Similar and Are PR Intervals Normal?
If P waves are all similar, and normal in shape, one can assume that the SA node is the primary pacemaker. In this case the rhythm is sinus in character. If P waves vary in shape or are absent, other tissue(s) are functioning as pacers.
The PR interval is normally 0.12 to 0.20 seconds (three to five small squares). Longer intervals indicate that the impulse is being delayed from entering the ventricles and the condition is designated AV block.
Step 4: Is the Rate Normal?
If the rhythm is regular, count the number of large squares between QRS complexes and divide this number into 300. However, if the rhythm is irregular, count the number of QRS complexes in a 6-second segment and multiply by 10. Rates below 60 indicate bradycardia; those above 100 indicate tachycardia. In Figure 6 there are approximately four large boxes between QRS complexes, so the rate is approximately 75.
Step 5: Do Waves and Complexes Proceed in Normal Sequence?
Each P wave should be followed by a QRS complex, which is followed by a T wave. This assures a normal sequence for each cardiac cycle.
ARRHYTHMIA IDENTIFICATION
Most basic courses in ECG interpretation emphasize the precise recognition of at least 15 to 20 arrhythmias. The primary objectives are rote memorization of a name for each rhythm and its deviant characteristics. However, this approach nurtures an inability to assess the clinical significance of a particular arrhythmia. ECG analysis must be correlated with the patient’s appearance and vital signs. Collectively, these will establish the clinical significance of the electrical disturbance and determine any indication for intervention. One method for organizing your thoughts is presented in the Table. By performing the first two steps described above, you can organize all basic arrhythmias into four groups (Table).
Rhythms in Group A
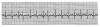
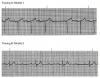
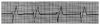
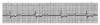
During the first two steps of your five-step analysis, you find that the R-R intervals are regular and all QRS complexes are narrow. From this, we know that the heart is being paced from tissue above the ventricle. The possible rhythms in group A are illustrated in Figure 7 through Figure 11. For each, apply step 3 through step 5 of your five-step analysis.
Rhythms in Group B
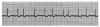
During the first two steps of your five-step analysis, you find that the R-R intervals are irregular but all QRS complexes are narrow. From this, we know that the heart is being paced from tissue above the ventricles. The possible rhythms in group B are illustrated in Figure 12 through Figure 14. For each, apply step 3 through step 5 of your five-step analysis.
Rhythms in Group C
During the first two steps of your five-step analysis, you find that the R-R intervals are regular but all QRS complexes are wide. From this, we know that the heart is being paced from tissue below the AV node, within the ventricles. The possible rhythms in group C are illustrated in Figure 15 through Figure 17. For each, apply step 3 through step 5 of your five-step analysis.
Rhythms in Group D
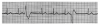
During the first two steps of your five-step analysis, you find that the R-R intervals are irregular and that the QRS complexes vary in shape. The possible rhythms in group D are illustrated in Figure 18 and Figure 19. For each, apply step 3 through step 5 of your five-step analysis.
About the Author
Dr. Becker is an Associate Director of Education, General Dental Practice Residency, at Miami Valley Hospital in Dayton, Ohio.
REFERENCES
1. Rosenberg MB, Campbell RL. Guidelines for intraoperative monitoring of dental patients undergoing conscious sedation, deep sedation, and general anesthesia. Oral Surg Oral Med Oral Pathol. 1991;71:2-8.
2. American Dental Association. Guidelines for the Use of Conscious Sedation, Deep Sedation and General Anesthesia for Dentists. Adopted by the House of Delegates, American Dental Association, October 2005.
3. Eichhorn JH, Cooper JB, Cullen DJ, et al. Standards for patient monitoring during anesthesia at Harvard Medical School. JAMA. 1986;256:1017-1020.
4. Guyton AC, Hall JE. Textbook of Medical Physiology. 10th ed. Philadelphia, Pa: WB Saunders Co; 2000.
5. Brunwald E, Zipes DP, Libby P. Heart Disease: A Textbook of Cardiovascular Medicine. 6th ed. Philadelphia, Pa: WB Saunders Co; 2001.
6. Goldberger AL. Clinical Electrocardiography: A Simplified Approach. 6th ed. St Louis, Mo: Mosby Inc; 1999.