You must be signed in to read the rest of this article.
Registration on CDEWorld is free. Sign up today!
Forgot your password? Click Here!
Owners of laboratories—both traditional and digital—need to understand what it takes to be profitable today, particularly in regard to the impact of the shift in how profits are realized. For example, the traditional lab, which has historically put a disproportionate amount of time into making products, is experiencing rising labor and shipping costs. In contrast, laboratories that are heavily focused on digital processes have lower labor costs, thanks to higher output per employee, and lower shipping costs due to electronic interfaces, but they have strikingly higher costs related to materials, maintenance and service of equipment, and overhead.
Profitability
Profit, which is the difference between income realized when the goods and/or services sold and the cost to produce them, is at the heart of running any type of business, including a laboratory.
The costs include: (1) labor—ie, the people working at the bench or machines; (2) the materials used to produce the unit, including those discarded or otherwise wasted; and (3) overhead, which is made up of funds spent on support systems to convert labor and materials to a finished product, including lights, heat, rent, tools, benches, insurances, and mortgages.
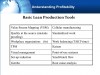
However, as Table 1 shows, 11% of laboratories actually lose money; and 40% realize net profit of sales of only 10% or less. Yet, there are laboratories that are substantially more profitable; 13% report net profit of more than 20% of sales, suggesting that it is possible for the underperforming laboratories to improve profitability by making a conscious effort to understand and apply good financial and production practices.
Business Management
Many owners find it uncomfortable to focus on the numbers side of the business—however dramatically these numbers are changing. The result is that the business side of their laboratories—eg, financials, marketing, purchasing—are not given the proper attention.
Because laboratory owners/managers are generally technicians themselves, all but the largest tend to spend the majority of their time on the bench. According to figures published by the National Association of Dental Laboratories (NADL) in 2011, on average, owners/managers spend 32.2% of their time on administrative/ management activities and 67.8% of their time on work as dental technicians. Also according to that same source, the average percentage of time spent on administrative/management activities increases with laboratory size: small (23.3%), medium (46.4%), and large (61.1%).
Financial Tools/Statements
To gain a better understanding of their own businesses, owners should be familiar with a number of financial tools/statements.
Financial statements provide the data business owners need to quantify the inflow and outflow of funds, thereby clarifying the financial information they need to make business decisions. They include profit and loss statements and balance sheets, which should be prepared and reviewed monthly. In addition, reports containing sales and cases or units should be prepared on a daily basis.
Profit and Loss (P&L) Statement
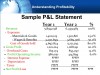
A profit and loss (P&L) statement—also known as an operating statement or income statement—shows how much money is made or lost in a given period of time. Every transaction can be placed in one of the following categories: labor, overhead, materials, or income, as reflected Table 2, a sample profit and loss statement.
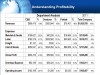
This same report can be applied on a departmental basis to identify good/bad performance within specific functions. As shown in Table 3, the “bottom line”—ie, Operating Income—shows that that dentures and partials are in need of attention.
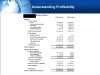
On the actual overall P&L (Table 4), there is much more detail, but the same categories still appear. In this particular example, the lab compares Actual to Budget. By doing this, labs can see where exactly they under- or over-spend. Overall, the lab represented in Table 4 is under budget by 11% (see lower right side); however, areas that are over budget and therefore in need of attention are: Implants (under Direct Costs Materials), which is 309% over; Freight (240% over), and Training (903% over).
Balance Sheet
Another crucial financial report is the balance sheet, which provides a financial snapshot of the company as of a specific date by reflecting its net worth/equity.
The Example Balance Sheet (Table 5) lists all assets and liabilities. In the accounting world, assets and liabilities cancel each other out. Current assets include cash in the bank and accounts receivable. Current liabilities include items such as trade accounts payable, payroll, and loan payment.
Ideally the balance sheet should show twice as much in assets as in liabilities. Businesses should run on an accrual basis in which cash is not recognized until is goes out to pay a bill or is received as payment. An accrual becomes an asset because it is receivable.
Using the Numbers
Balance sheet ratios
From the balance sheet come two different ratios that can tell owners much about the health and welfare of their enterprise. The current ratio—also known as the liquid ratio—is calculated by dividing assets by liabilities. It is a reflection of near-term solvency; 2.4 is considered healthy. The return on asset ratio is calculated by dividing current assets by current liabilities. It reflects the rate of return received for each $1 dollar invested in the laboratory.
Key business indicators
Data generated and analyzed in various ways is used to define and measure the different aspects of the enterprise at different points in time and may be used to focus on key aspects of the business. For example, by monitoring volume, mix, and demand patterns, the owner can determine the busiest times of the day and week, and make staffing and material decisions accordingly.
Some recommended business measures include:
• Daily Sales Report/Daily Unit Report—Both should have comparisons to a previous period.
• Annual revenue per lab staff—Labor as a % of sales (goal of 40%)— Divide total labor costs by total sales
• Materials % of Sales (goal of 22%)— Divide the cost of all materials into total sales
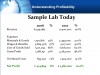
• Units/lab staff/day (output per employee) —Daily units produced divided by the number of technicians; should show a positive trend that indicates the workforce is more productive (Table 6).
• Gross Profit (goal 8%)
• Operating Profit (goal 20%)
As shown in Table 7, a profitable lab should be generating at least 20% profit by being aware of and attentive to both the costs—materials, labor and benefits, cost of good sold, and overhead—and revenue generated.
Lean Production Management: Understanding the Basics
Another important aspect of being profitable that may be uncomfortable for laboratory owners is changing the numbers by changing their familiar way of doing things—ie, by adopting principles of lean production management—to stimulate sales while at the same time reducing operating cost.
This starts with having reasonable goals and involves having: a vision, willingness to change, and a workable methodology. However, using proven strategies, many businesses, including laboratories have achieved significant results in a short amount of time, for example, increasing productivity, while reducing throughput-time, 6 months total inventory; floor space required, and work in process.
Such improvements are achievable, all while overcoming challenges such as competition; finite capacity in machines, people, and processes; loss of experienced technicians; and difficulty of finding qualified technicians.
The term lean is used because a lean business uses less in terms of resources such as:
• Labor to perform tasks
• Manufacturing space
• Capital investment
• Materials
• Time between the customer order and the product shipment
• Time to process paperwork
• Supplier investment
Lean is a philosophical approach to developing flexible, responsive processes capable of providing customers with what they want, in the amount they need, exactly when they want it. At the heart of Lean are flexible, motivated team members continuously solving problems.
The Challenge of Implementing Change
Change is a difficult process. It is uncomfortable and frustrating. It takes a lot of energy, work, and getting used to. It causes confusion. There is fear of unknown, failure, making mistakes and losing what you already have.
To implement change, it is important to understand what motivates organizational change. This motivation may come from many different sources, including: (1) problems and issues that demand immediate attention and can seriously damage the organization, its profitability, and ability to survive; (2) changing expectations/demands from customers, who want better, faster, and more for less—impacting quality, delivery, cost/price, service; (3) a desire to enhance and improve the well being, growth, income or the value of the organization through a specific course of action; and (4) competitive pressure to work hard and fast to stay ahead of the pack, to prevent customers from going elsewhere
Despite the motivation to change, obstacles to implementation may well include resistance from employees. Some strategies to help overcome resistance to change include:
Getting employees involved before the start of the change process—help them understand the reasons for change and involve them in developing the system
Communicating how the change will take place in a nonthreatening and inclusive way—reduce fear and build trust; create a safe environment without blame or repercussions for voicing their worries; create an environment where people are willing to take risks
Creating some quick wins and successes—by demonstrating examples of success and positively reinforce changes with rewards and recognition
Value-Added vs Non–Value Added Activities
To identify and eliminate waste, which is the main objective of lean management, it is important to understand the difference between activities that do or do not add value
Activities that transforms or shapes raw material or information to meet true customer requirements are value-adding, while those that take time, resources, or space, but do not transform, or add to the customer’s desired or perceived value of a product are non-value adding. Among non-value adding activities are necessary evils—ie, those that must be performed due to customer, legislative, or regulatory requirements but do not transform product or service.
To identify which activities fit which definition, it is helpful to discuss the different activities in terms of whether they are value added or not by asking questions such as: Is this activity necessary? Does it generate income?
The fundamental principle of lean is that anything that does not add value to the product—including necessary evils— is waste and must be reduced or eliminated. Some frequent causes of waste are listed in Table 8. In a laboratory, they generally fall into eight categories that conform to the acronym DOWNTIME: Defects, Overproduction, Waiting, Not utilizing employees (knowledge, skills, abilities), Transportation, Inventory, Motion, and Excess processing.1
For example;
D—Defects and the bottom line
Among the top defects leading to remakes seen in a lab are those involving shades, margins, occlusion, and contacts. If the percentage of remakes includes those due to internal errors, it may rise from the widely quoted 3% to 4% to an actual 6% to 7% level. To understand and demonstrate to employees the impact of internal errors on profitability, one can calculate the cost of a remake by adding in the material, labor, and overhead from the P&L generated from first time the unit was produced, to the one the second time; this number should be added a third time to represent the lost opportunity cost associated with units not made and sold due to time and materials spent on that “do-over.” The average lab, which makes a 5% profit, would need to make an additional 19 units to pay for a single remake.
I—Inventory: striking the right balance
Inventory is included in the DOWNTIME categories because its proper handling can be crucial to profitability in that too much deprives the business of cash flow, but too little inhibits the lab’s ability to produce products. Inventory takes two forms— work-in-process and stock-in-house (materials, metals, powders, consumables). Work-in-process is revenue waiting to be realized. The longer it sits, the longer it takes to be converted into income. Stock-in-house is cash that is unavailable to run the business.
Basic Lean Production Tools
Various lean production tools—including those described below—have been defined to help organizations implement programs to streamline their operations in keeping with waste reduction and improved efficiency and profitability (Table 9).
Kaizen Strategy—Focus on Human Resources
Kaizen is a Japanese word meaning gradual and orderly improvement. The Kaizen business strategy involves everyone in an organization’s working together to make improvements without large capital investments. Kaizen is a culture of sustained continuous improvement focusing on eliminating waste in all systems and processes of an organization. With Kaizen, an involved leadership guides people to continuously improve their ability to meet expectations of high quality, low cost, and on-time delivery.
Value Stream Mapping
Value stream mapping (VSM) is a method of identifying opportunities to reduce waste and errors. It involves following steps: (1) following the path of a product/transaction from beginning to end and (2) drawing a visual representation of every process in the product/transaction and information flow, then (3) drawing a “future state” map of how value should flow.2
Poka-yoke Mistake-Proofing
Many labs today take a “detection” approach to quality. Poka-yoke is any process that either prevents a mistake from being made or makes the mistake obvious at a glance. This prevention approach is based on creating processes that cannot produce a defect or remake. Visual standards, standard work sheets/instructions, training, equipment, and tools are all methods to ensure mistakes are minimized.3
Workplace Organization- 6S
Workplace Organization (more commonly known as 6S)4 focuses on the design and maintenance of an organized and clean workplace. Cleanliness in a lab is just good business practice, and keeping organized reduces the non-value added time of walking and searching for tools, trays, workspace, and scripts.4
• First S: Sort (Organization)—Distinguish between what is needed and not needed-and throw it away if it is not needed.
• Second S: Stabilize (Orderliness)—A place for everything and everything in its place.
• Third S: Shine (Cleanliness)—Cleaning and looking for ways to keep it clean.
• Fourth S: Standardize (Promote Adherence)—Share established standards and make standards obvious.
• Fifth S: Sustain (Self-Discipline)—Stick to the rules and maintain the first four S’s.
• Sixth S: Safety (Safe environment)—Promote and maintain an accident-free workplace
Small batch flow
The small batch flow approach involves reducing lot sizes, which leads to flexibility and shorter lead times. An organization adhering to this method produces only what is needed when it is needed (equal to the rate of sales) and drives pull systems that connect the processes from end to end. It also drives employees in work teams instead of grouping them by process function.
Visual process and management
Workplaces that adhere to visual process and management principles are set up with signs, labels, color-coded markings and other visual information, such that anyone unfamiliar with the process can, in a matter of minutes, know what is going on, understand the process, and know what is being done correctly. It keeps employees informed about how their efforts affect the outcome and gives them the power and responsibility to reach their goals. It also emphasizes the formation of a partnership among workers, managers, and skilled and technical staff in which the parties are responsible to each other for the outcome.
Performance measurement
Linked performance measurements provide guidance and visibility through the organization. The wrong measurements will drive a performance that may not lead to desired profitability. For example, many labs measure number of units/day per technician but do not measure remake rates. This measure typically will drive technicians to produce their daily quota, but what happens if the technician produces a high rate of remake? As can be seen in Table 10, cycle time and on-time delivery (customer satisfaction) are negatively impacted, thus having a negative impact on gross profit. In other words, the “local indicators” must be properly aligned with the top-level business measures to ensure meeting profitability goals.
Conclusion
In the current economic environment, many laboratories are struggling to remain profitable. While change is a difficult process for owners and their staff members, they have much to gain by familiarizing themselves with the numbers that are the key to identifying problem areas and implementing strategies designed to overcome them. By focusing on the value-adding activities that transform or shape raw material or information to meet true customer requirements and reducing or eliminating those that do not, they can place themselves on the path to greater profitability.
About the Author
Bob Yenkner manages his own consulting business that provides Lean program development support to clients in the Clinical Trials, Dental Laboratory, and Metal Shaping industries. As an Adjunct Professor in the Connecticut Community College system, teaches a Lean Enterprise curriculum he co-developed. He has also written numerous articles about Lean deployment and has authored the book “Wrestling the Gorilla.” a do-it-yourself guidebook to implementing a basic Lean production system.
For more information go to www.practicalprocessimprovementct.com.
Reference
1. Yenkner B. Be more productive: Remove “waste” from your laboratory processes. Inside Dental Products. 2013;4(9).
2. Yenkner C, Yenkner B. Value stream mapping. Inside Dental Products 2013;4(3).
3. Yenkner B. The secret behind controlling quality. Inside Dental Products 2014; 5(1).
4. Yenkner B. Why implement 6S in your laboratory? Inside Dental Products. 2014;5(3).